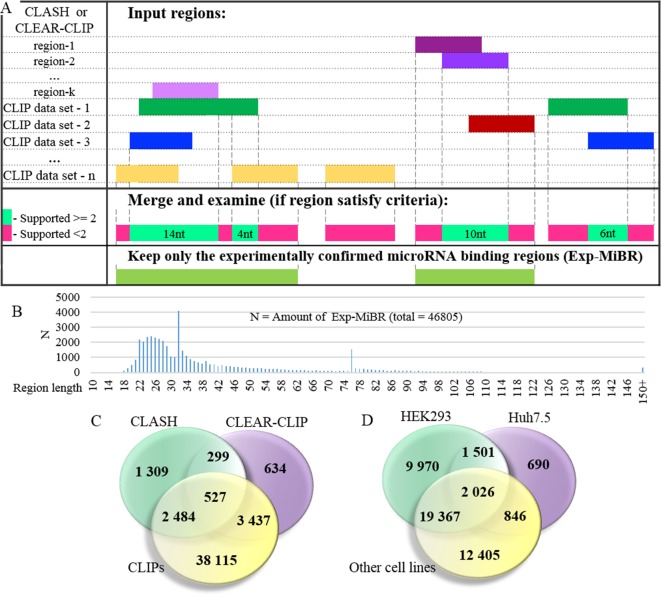
Figure 3.
Detailed analysis of experimentally confirmed microRNA-binding regions (Exp-MiBRs). (A) Validation of the Exp-MiBR by their independent occurrence in two or more datasets, or in two or more chimeric sequences from one dataset. (B) Exp-MiBRs: distribution of the lengths. On horizontal axis—the length of the Exp-MiBRs subsequence; on vertical axis—amounts of the detected Exp-MiBRs (N). (C). Venn diagram depicting Exp-MiBRs detected in experiments employing three different types of identification techniques. (D) Venn diagram depicting tissue specificity of Exp-MiBRs detected in HEK293, Huh7.5, and all other cell lines.

