
Figure 4.
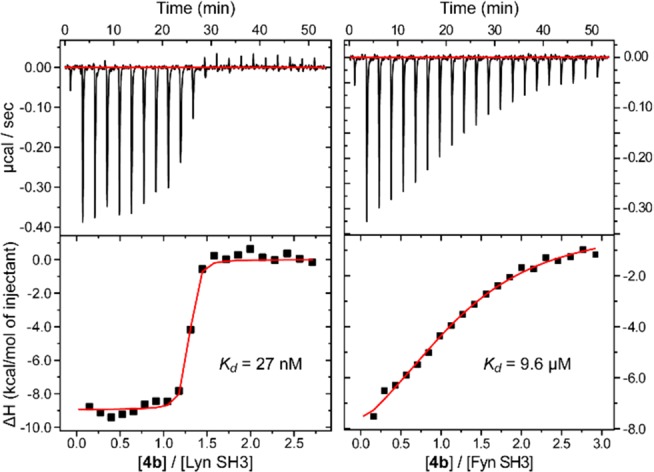
ITC curves acquired by titration of medium-length metalloligand 4b (275 μM) into Lyn SH3 and Fyn SH3 (18 μM). Raw data with baseline corrected (top) and injection peak integrals (bottom).
Official websites use .gov
A
.gov website belongs to an official
government organization in the United States.
Secure .gov websites use HTTPS
A lock (
) or https:// means you've safely
connected to the .gov website. Share sensitive
information only on official, secure websites.
ITC curves acquired by titration of medium-length metalloligand 4b (275 μM) into Lyn SH3 and Fyn SH3 (18 μM). Raw data with baseline corrected (top) and injection peak integrals (bottom).