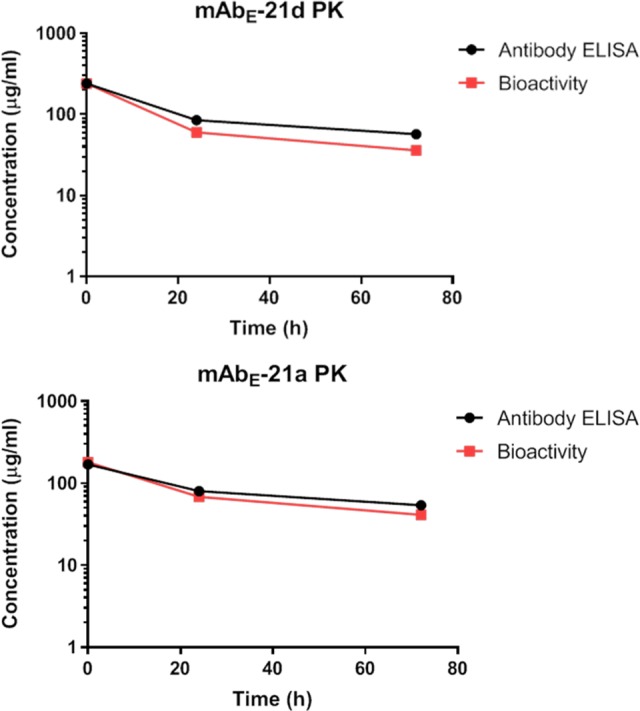
Figure 5.

Plots of concentration (μg/mL) vs time of the mAb component (average) and retained bioactivity (pooled samples) of ADCs at 2 min, 1 day, and 3 day time points post administration in mice: mAbE-21d (top) and mAbE-21a (bottom).

Plots of concentration (μg/mL) vs time of the mAb component (average) and retained bioactivity (pooled samples) of ADCs at 2 min, 1 day, and 3 day time points post administration in mice: mAbE-21d (top) and mAbE-21a (bottom).