Figure 1.
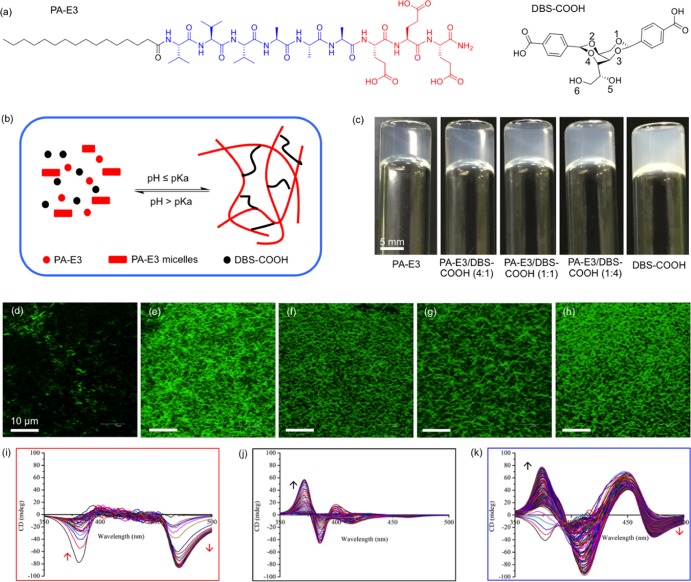
Molecular information and sol-gel phase transition. (a) Molecular structure of PA-E3 and conformational perspective of the molecular structure of DBS-COOH (the numbering indicates alcohol groups on the sugar backbone). (b) Schematic representation of supramolecular self-sorting of PA-E3 and DBS-COOH by pH-switching. (c) Photographs of hydrogels of PA-E3, DBS-COOH, and PA-E3/DBS-COOH mixtures. Laser scanning confocal micrographs of nanofibers of (d) PA-E3, (e) PA-E3/DBS-COOH (4:1), (f) PA-E3/DBS-COOH (1:1), (g) PA-E3/DBS-COOH (1:4), and (h) DBS-COOH. Induced circular dichroism spectra of ThT during the self-assembly of (i) PA-E3, (j) DBS-COOH, and (k) PA-E3/DBS-COOH (1:1). Arrows indicate increasing CD intensity as a function of gelator self-assembly. Data acquired at 2 min interval.

