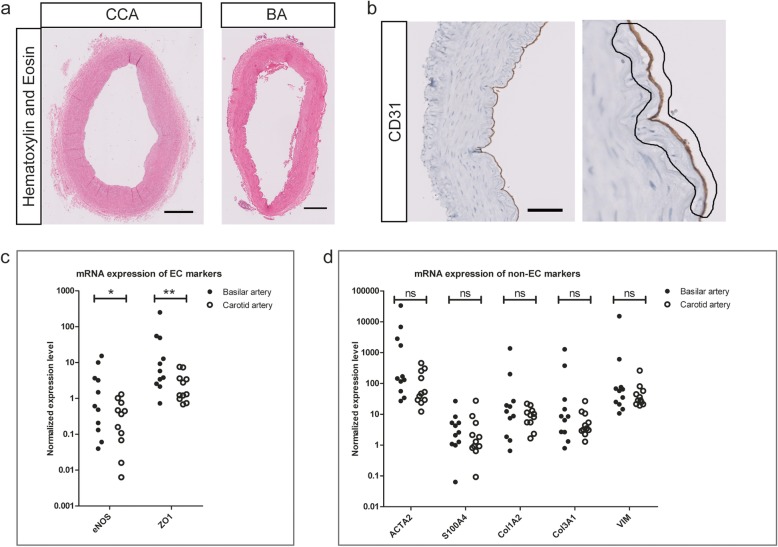
Fig. 1.
Laser capture microdissection of macroscopically normal CCA and BA (a) Cross-sections of macroscopically normal CCA and BA, depicted with Hematoxylin and Eosin staining. Scale bar for CCA and BA represents resp. 1200 and 300 μm. b Vessel wall of BA (left, marked by CD31 in brown, scale bar represents 120 μm) and higher magnification vessel wall (right) with selected area depicting representative LCM cutting margins for EC collection. c Significant differential expression of eNOS and ZO1 between the BA and CCA measured by qPCR. d No significant difference of smooth muscle cell (ACTA2) and fibroblast (S100A4, Col1A2, Col3A1, VIM) marker expression in LCM-collected population of the BA compared to the CCA samples. c, d Data are depicted as expression level normalized against CD31 and vWF. Significance level determined by Wilcoxon signed rank test, p < 0.05 (*) and p < 0.01 (**) considered significant. n = 11 patients. ACTA2 = Actin alpha 2, CD31 = Cluster of differentiation 31, Col1A2 = Collagen type I alpha 2, Col3A1 = Collagen type Ill alpha 1, eNOS = endothelial Nitric Oxide Synthase, S100A4 = S100 Calcium Binding Protein A4/Fibroblast specific protein 1, VIM = Vimentin, ZO1 = Zona Occludens Protein 1

