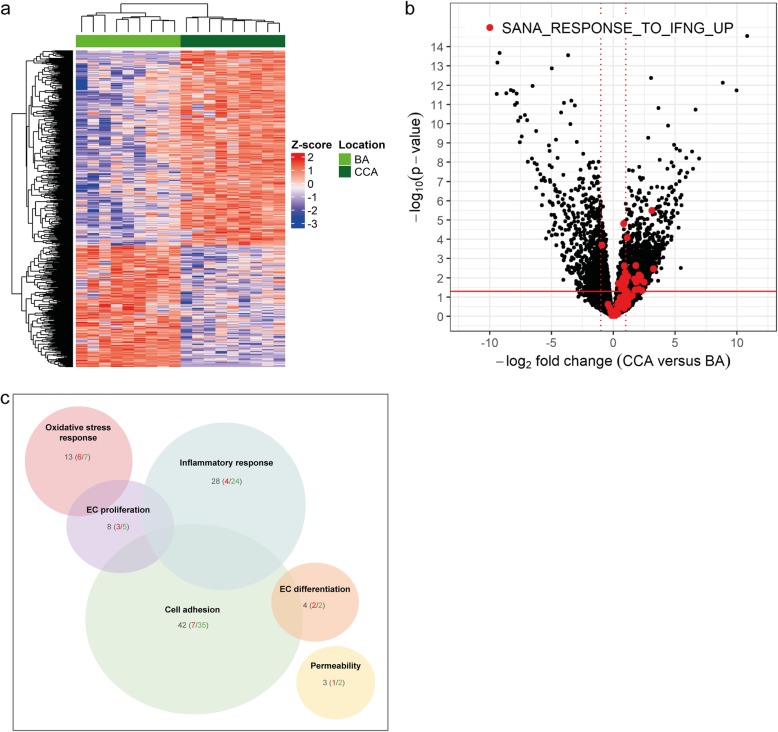
Fig. 2.
Differential regulation of immune- and EC damage response genes in the ECs of the BA compared to the CCA (a) Heatmap of the 593 differentially expressed genes (absolute log2-fold-change > 2 and adjusted P-value < 0.05). Dendrogram using Euclidean distance and complete linkage. Color coding corresponds to z-score of logCPM values from blue (downregulated) to red (upregulated). b Volcano plot with black dots depicting individual genes. In red, genes that were also found to be upregulated by IFNγ in a published dataset (MSigDB ID: M4551) [49]. Solid red line corresponds to a P-value = 0.05. Dotted red lines correspond to an absolute log2-fold-change of 1. c Venn diagram with genes related to EC damage response with absolute log2-fold-change > 2 and p-value < 0.05. Numbers in grey are total genes in subgroup, in red are the genes higher expressed in the BA, in green the genes higher expressed in the CCA

