Fig. 3.
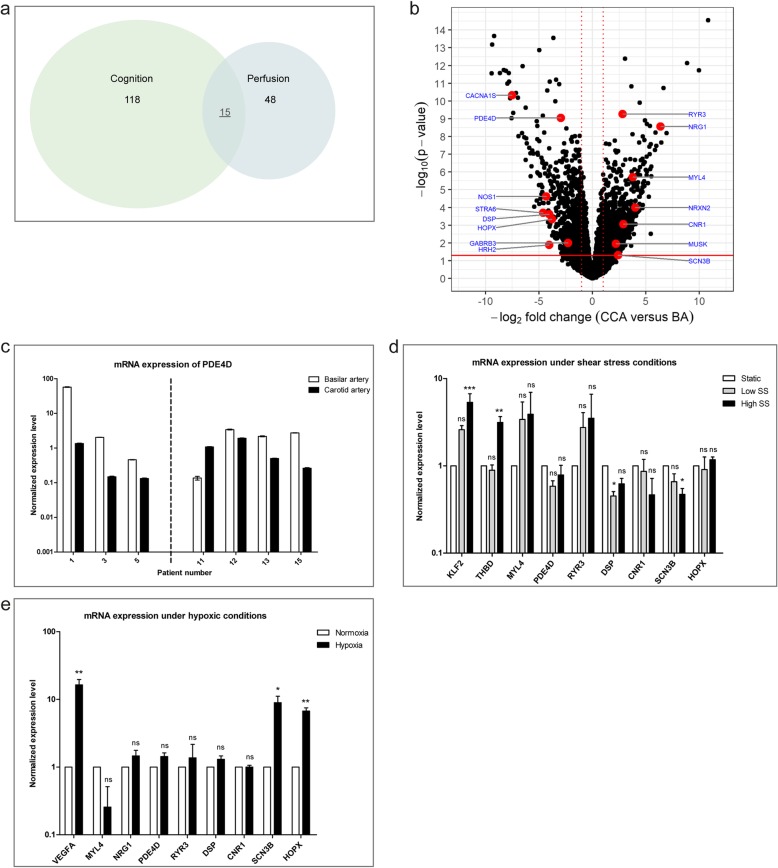
A role for DSP, HOPX and SCN3B in EC shear stress and/or hypoxia regulation (a) Venn diagram of differentially expressed genes that are involved in cognition (118 genes), perfusion (48 genes) or both (15 genes, underscored) with absolute log2-fold-change > 2 and p-value < 0.05. b Volcano plot of RNA sequencing data with black dots depicting individual genes. In red the genes differentially expressed and involved in perfusion and cognition. Solid red line corresponds to a P-value = 0.05. Dotted red lines correspond to an absolute log2-fold-change of 1. c Technical and biological validation with qPCR of one representative gene (n = 3 technical replicates). Patients 1, 3, 5 were used in RNA sequencing experiment (technical validation), patient 11, 12, 13, 15 were not used in RNA sequencing experiment (biological validation). Expression is normalized against CD31 and vWF expression. Dashed line indicates two independent experiments. d The effect of shear stress conditions on gene expression. KLF2 and THBD are used as positive controls. SCN3B and DSP are significantly downregulated upon shear stress conditions (n = 3–5 shear stress experiments, Friedman test). static = 0 dyne/cm2, low = 0.75dyne/cm2, high = 10dyne/cm2. Expression of individual genes is normalized against Rplp0 and B-actin expression and compared to the static condition. e The effect of hypoxic conditions on gene expression. VEGFA is used as positive control. SCN3B and HOPX are significantly upregulated upon hypoxia (n = 5 hypoxia experiments, Paired t-test). Normoxia = 20% O2, hypoxia = 1% O2. Expression of individual genes is normalized against B2M expression and compared to the normoxia condition. c, d and e Mean with SEM is depicted. d, e Significance level of p < 0.05 (*), p < 0.01 (**) and p < 0.001 (***) is considered significant. For full genes names see Additional file 1: Table S2

