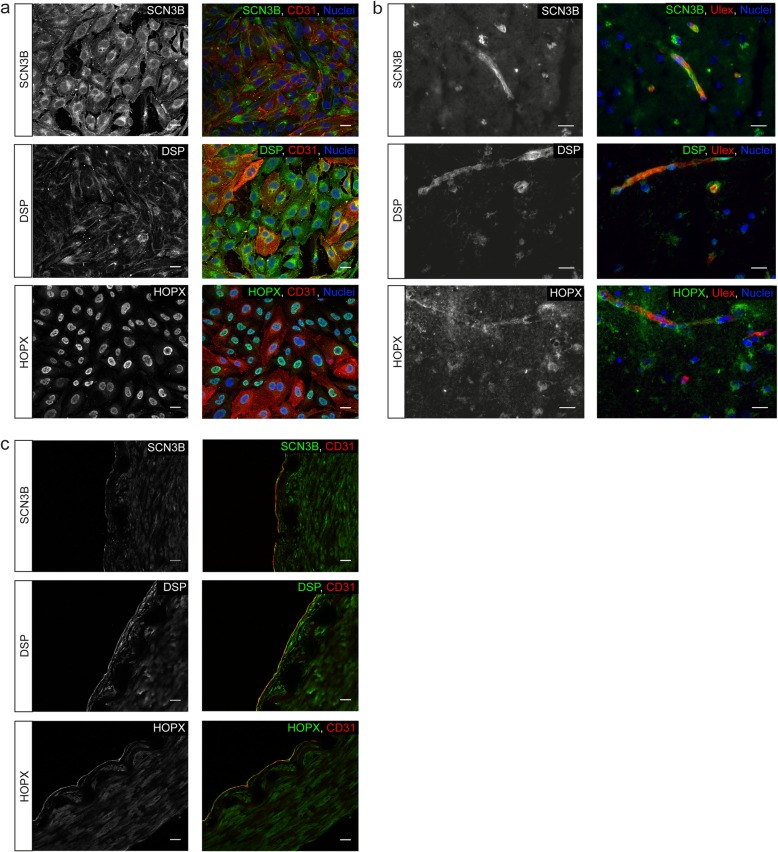
Fig. 4.
Expression profile of SCN3B, DSP and HOPX in brain ECs. Localization of DSP, HOPX and SCN3B in (a) human brain ECs in vitro, (b) post-mortem human cortical microvasculature and (c) post-mortem human BA (of one representative patient). SCN3B upper panel, DSP middle panel and HOPX lower panel. Overlay depicts SCN3B, DSP or HOPX in green, ECs in red (CD31 for a and c, Ulex for b) and (a, b) nuclei in blue. a, b, c Scale bar represents 20 μm

