Fig. 7.

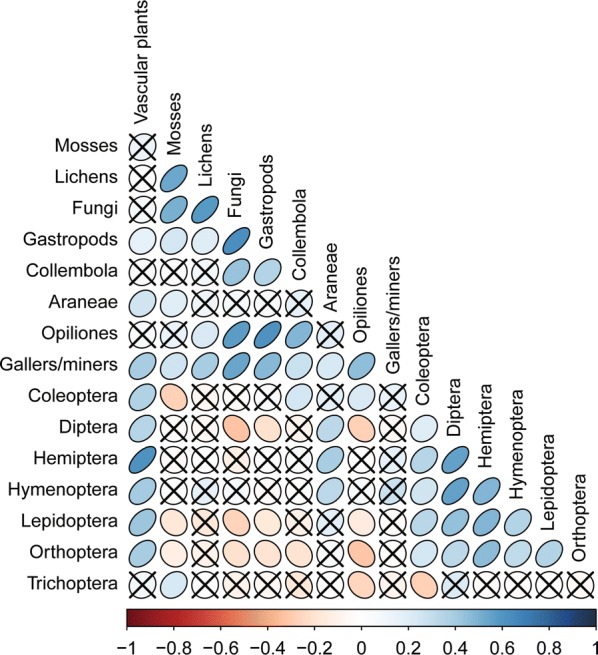
Cross correlation among the main taxonomic groups included in the study. The colour and shape of the symbol is scaled according to spearman rank correlation coefficients and non-significant (p > 0.05) correlations are indicated by a cross

Cross correlation among the main taxonomic groups included in the study. The colour and shape of the symbol is scaled according to spearman rank correlation coefficients and non-significant (p > 0.05) correlations are indicated by a cross