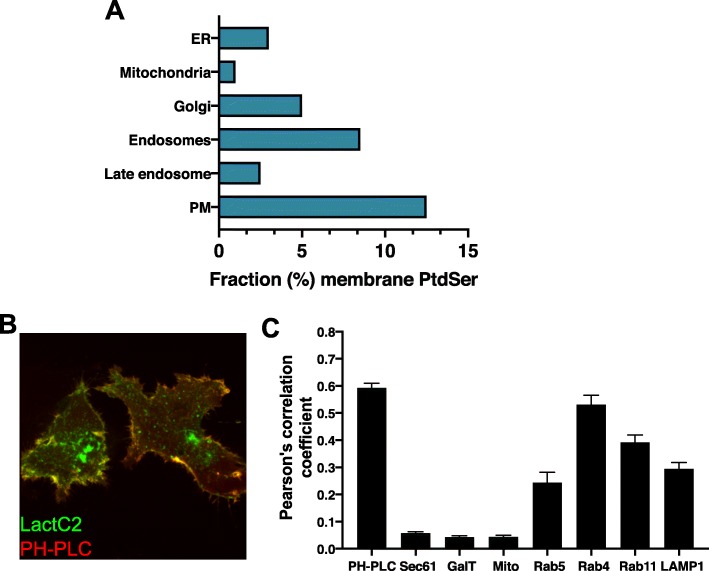
Fig. 1.
Intracellular distribution of PtdSer. a Relative abundance of PtdSer in membranes as mol% of total lipids throughout organelles of the cell. ER – endoplasmic reticulum, PM – plasma membrane. b, c The probe LactC2 labels cytoplasmic-facing leaflets containing PtdSer. When co-expressed with additional organellar markers (such as the plasma membrane labelling PH-PLC (b)) relative correlations as determined by calculation of Pearson’s correlative co-localization (c) can be determined as a proxy for the relative amounts of PtdSer in the cytoplasmic-facing leaflets of organelles (as first published in Hirama et al. [48]). Markers for plasma membrane (PH-PLC), ER (Sec61), Golgi (GalT), mitochondria (Mito (MitoTracker)), early endosomes (Rab5), fast and slow recycling endosomes (Rab4 and Rab11, respectively) and lysosome (LAMP1) are shown. The lack of ER and Golgi labeling by LactC2 suggests a lack of PtdSer in the cytoplasmic leaflets as discussed in the text

