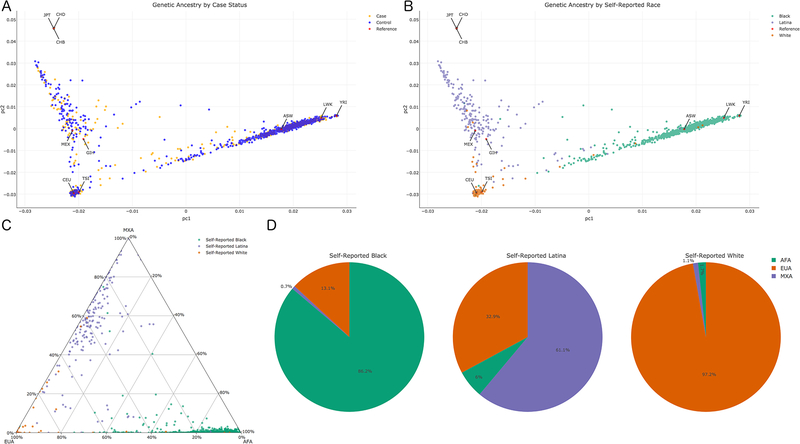
Figure 1.
Genetic Ancestry of Study Participants. A) Principal Component plot of cases (orange), controls (blue), and HapMap references (red). B) Principal Component plot of self-reported race: Black (green), Latina (purple), White (orange), and HapMap references (red). C) Ternary plot of fastStructure estimated percent ancestry for each participant. D) Average genetic ancestry composition for each self-reported racial group. Abbreviations: African ancestry in Southwest USA (ASW); Utah residents with Northern and Western European ancestry (CEU); Han Chinese in Beijing, China (CHB); Chinese in Metropolitan Denver, CO (CHD); Gujarati Indians in Houston, TX (GIH); Japanese in Tokyo, Japan (JPT); Luhya in Webuye, Kenya (LWK); Mexican ancestry in Los Angeles, CA (MEX); Toscani in Italia (TSI); Yoruba in Ibadan, Nigeria (YRI)

