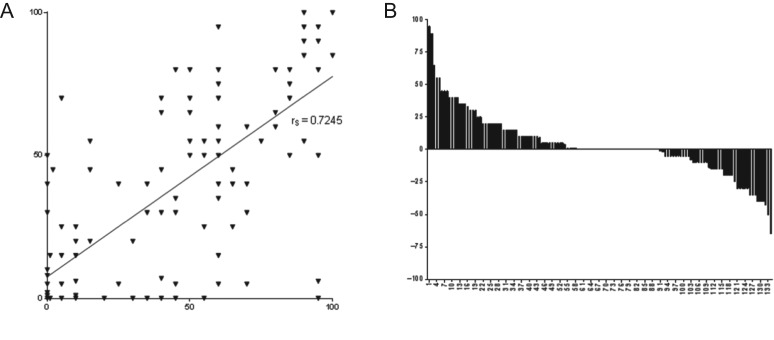
Figure 2.
CLDN18.2 expression in matched pairs of primary tumors and corresponding LN metastases.
- The percentage of CLDN18.2-positive tumor cells in the primary tumor is indicated on the X axis, the percentage in the corresponding LN metastasis on the Y axis. Each ▾ represents one patient. Line shows Spearman’s correlation of stained tumor cells in primary tumors and LN.
- Difference in relative fraction of positive tumor cells for each case of intra-individually matched sample.
LN, lymph node.

