. 2019 Jul 17;127(7):077005. doi: 10.1289/EHP4599

Figure 2.

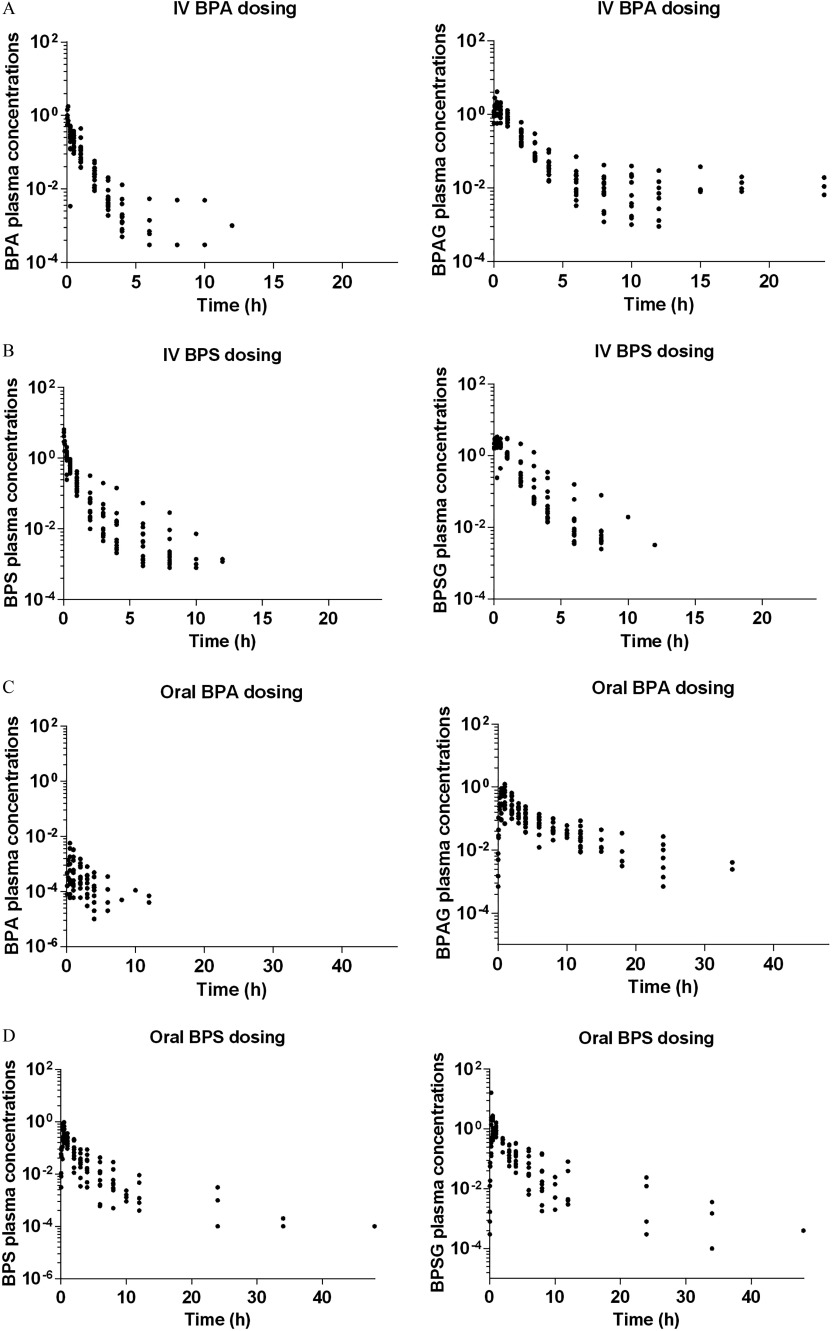
Figure 2A comprises two graphs plotting BPA plasma concentrations and BPAG plasma concentrations, respectively, (y-axis) across time (hours; x-axis) for IV BPA dosing. Figure 2B comprises two graphs plotting BPS plasma concentrations and BPSG plasma concentrations, respectively, (y-axis) across time (hours; x-axis) for IV BPS dosing. Figure 2C comprises two graphs plotting BPA plasma concentrations and BPAG plasma concentrations, respectively, (y-axis) across time (hours; x-axis) for oral BPA dosing. Figure 2D comprises two graphs plotting BPS plasma concentrations and BPSG plasma concentrations, respectively, (y-axis) across time (hours; x-axis) for oral BPS dosing.

Semilogarithmic plots of individual plasma concentrations relative to dose (μmol/L  per  μmol/kg BW) vs. time (h) of BPA and BPAG after IV (Figure 1A) and oral BPA dosing (Figure 1C) and of BPS and BPSG after IV (Figure 1B) and oral BPS dosing (Figure 1D) in piglets. BPA, Bisphenol A; BPAG, Bisphenol A glucuronide; BPS, Bisphenol S; BPSG, Bisphenol S glucuronide; BW, Body Weight; IV, Intravenous.