. 2019 Oct 10;61:e57. doi: 10.1590/S1678-9946201961057

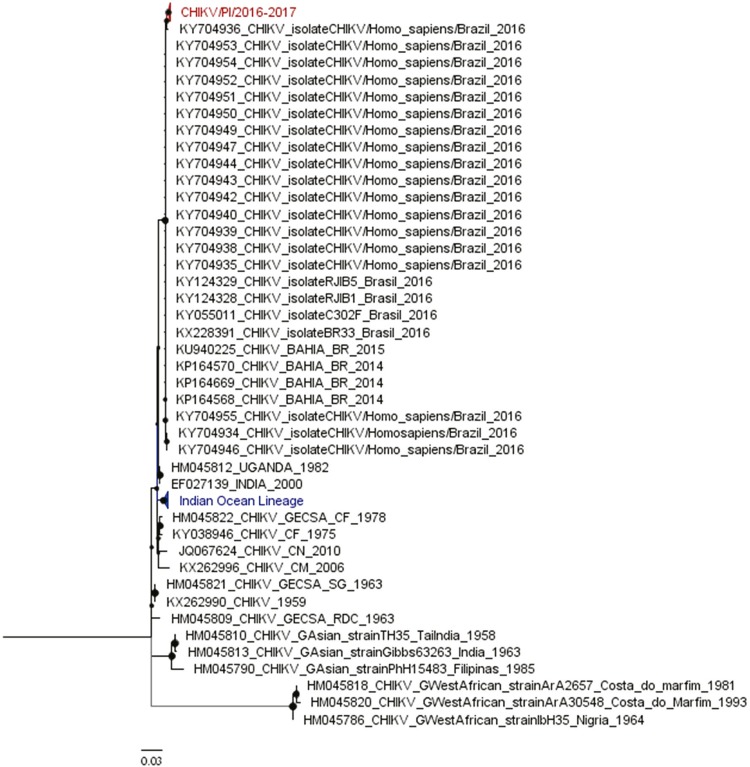
Supplemental Figure 1. Maximum likelihood analysis of Chikungunya virus. The maximum likelihood tree was inferred using 88 Chikungunya virus sequences (328 nt). The bootstrap values are represented by circles drawn in scale in the nodes. Clades containing strains from Piaui (2016/2017), and Indian Ocean Lineage are shown in red and blue, respectively. Branch lengths are drawn to scale or the number of substitutions per site. The tree was reconstructed using the nucleotide substitution model Kimura- 2-parametrers with gamma distribution (four categories) (K2+G). PI: Piaui State. GECSA: Genotype East-Central South African. Gwest African: Genotype West African. GAsian: Genotype Asian. CHIKV: Chikungunya virus.

Supplemental Figure 1