. 2019 Sep 25;127(9):097006. doi: 10.1289/EHP4815

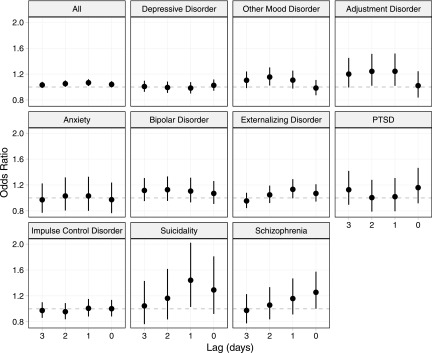
Figure 1.

Figure 1 has eleven graphs, namely, all, depressive order, other mood order, adjustment disorder, anxiety, bipolar disorder, externalizing disorder, PTSD, impulse control disorder, suicidality, and schizophrenia plotting odds ratio (ranging from 0.8 to 2.0 in intervals of 0.4) (y-axis) across lag days (ranging from 3 to 0 in a descending order in unit intervals) (x-axis).

Odds ratios and 95% confidence intervals for associations between a 10-μg/m3 increase in PM2.5 and pediatric psychiatric emergency department visits from conditional logistic regression models adjusted for temperature, humidity, and holidays. Numeric data for all results are provided in Table S3.