. 2019 Sep 25;127(9):097006. doi: 10.1289/EHP4815

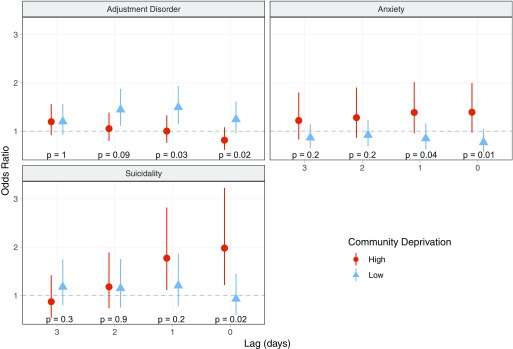
Figure 2.

Figure 2 has three graphs, namely, adjustment disorder, anxiety, and suicidality plotting odds ratio (ranging from 0 to 3 in unit intervals) (y-axis) for community deprivation (high and low) across lag days (ranging from 3 to 0 in a descending order in unit intervals) (x-axis). For adjustment disorder, the community deprivation values are as follows: p equals 1, p equals 0.09, p equals 0.03, and p equals 0.02. For anxiety, the community deprivation values are as follows: p equals 0.2, p equals 0.2, p equals 0.04, and p equals 0.01. For suicidality, the community deprivation values are as follows: p equals 0.3, p equals 0.9, p equals 0.2, and p equals 0.02.

Odds ratios and 95% confidence intervals for associations between a 10-μg/m3 increase in PM2.5 and pediatric psychiatric emergency department (ED) visits stratified by community deprivation from conditional logistic regression models adjusted for temperature, humidity, and holidays. In accord with a priori selection criteria, we estimated associations only for psychiatric ED visit categories that showed significant effect modification (p<0.05) for at least one exposure lag. Interaction p-values for all ED visit categories are provided in Table S4 and corresponding numeric data are provided in Table S5.