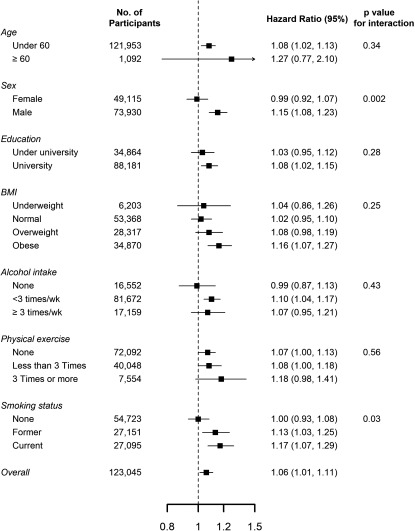
Figure 3.
Hazard ratios (95% confidence intervals) for incident depression () associated with a increase in 60-month concentrations, by baseline subject characteristics. Hazard ratios were adjusted for age, sex, study center, year of visit, educational level, smoking status, body mass index, alcohol consumption, and physical activity. Education was categorized as university () and less than university (, including no education, elementary school, middle school, high school, and technical college). p-Values were derived from likelihood ratio tests comparing models that included an interaction (product) term between air pollution exposure and the effect modifier vs. models without the interaction term. Results for missing categories are not shown because some of these categories were very small.

