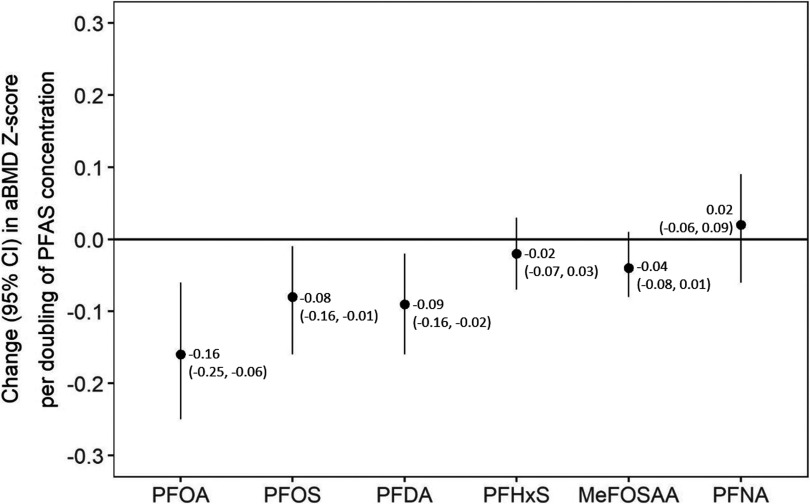
Figure 1.
Single-per- and polyfluoroalkyl substance (PFAS) models showing adjusted associations of individual PFAS plasma concentrations with areal bone mineral density (aBMD) z-score. Note: Adjusted for maternal age, education, census tract median household income, individual household income, and child age, sex, race/ethnicity, year of blood draw, dairy intake, and physical activity. for all single-PFAS models. CI, confidence interval; PFOA, perfluorooctanoic acid; PFOS, perfluorooctanesulfonic acid; PFDA, perfluorodecanoate; PFHxS, perfluorohexane sulfonate; MeFOSAA, 2-(N-methyl-perfluorooctane sulfonamide) acetate; PFNA, perfluorononanoate.

