. 2019 Aug 8;127(8):087002. doi: 10.1289/EHP4812

Figure 1.

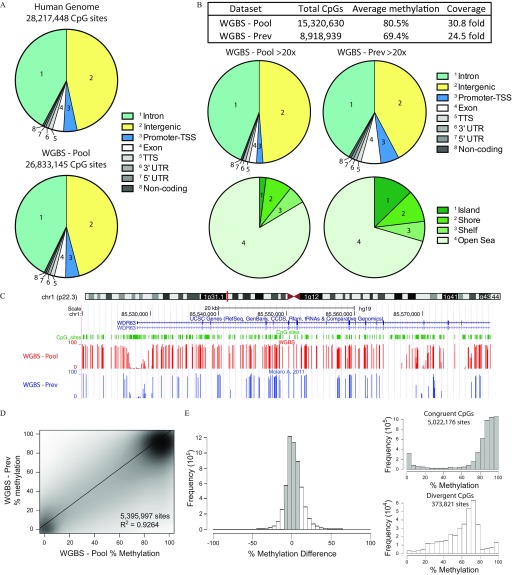
Figure 1A displays two pie charts, namely, Human Genome 28217448 CpG sites and WGBS – Pool 26833145 CpG sites. The pie charts have eight parts each. The labelings for the eight parts are inset as follows: Intron, Intergenic, Promoter-TSS, Exon, TTS, 3 prime UTR, 5 prime UTR, and noncoding. Figure 1B comprises a table and four pie charts. The table has four columns, namely, data set, Total CpGs, average methylation, and coverage. The first pair of pie charts, where the first chart has eight parts and the second chart has four parts, is labeled WGBS – Pool greater than 20x.The second pair of pie charts, where the first chart has eight parts and the second chart has four parts, is labeled WGBS – Prev greater than 20x. The labelings for the charts with eight parts are inset as follows: Intron, Intergenic, Promoter-TSS, Exon, TTS, 3 prime UTR, 5 prime UTR, and noncoding. The labelings for the charts with four parts are inset as follows: Island, Shore, Shelf, and Open Sea. Figure 1C is of a Genome browser displaying DNA methylation tracks from WGBS-Pool and WGBS-Prev data sets on a scale of chr1 (p22.3). Figure 1D is a scatter plot, plotting WGBS – Prev percentage methylation (ranging from 0 to 100 in intervals of 20) (y-axis) across WGBS – Pool percentage methylation (ranging from 0 to 100 in intervals of 20) (x-axis). Data inset is as follows: 5,395,997 sites R superscript 2 equals 0.9264. Figure 1E displays three histograms. The first histogram plots frequency (10 superscript 5) (ranging from 0 to 12 in intervals of 2) (y-axis) across percentage methylation difference (ranging from negative 100 to 100 in intervals of 50) (x-axis). The second histogram plots frequency (10 superscript 5) (ranging from 0 to 10 in intervals of 2) (y-axis) across percentage methylation (ranging from 0 to 100 in intervals of 20) (x-axis) for congruent CpGs 5,022,176 sites. The third histogram plots frequency (10 superscript 4) (ranging from 0 to 6 in intervals of 2) (y-axis) across percentage methylation (ranging from 0 to 100 in intervals of 20) (x-axis) for divergent CpGs 373,821 sites.

Whole genome bisulfite sequencing (WGBS) of human sperm DNA. (A) Examination of the genomic distribution of CpG sites found within the human genome (top) and from WGBS (bottom) of a pooled DNA sample (WGBS-Pool). (B) Analysis of highly covered (>20×) sites from WGBS-Pool and that of WGBS-Prev examining their genomic distribution and their location within CpG islands, shores and shelves. (C) Genome browser view of DNA methylation tracks from WGBS-Pool and WGBS-Prev data sets. (D) Scatter plot of common CpGs sequenced at >20× between WGBS data sets. (E) Difference in DNA methylation of common CpG sites (WGBS-Pool minus WGBS-Prev, left). DNA methylation of sites congruent (±10% methylation difference, shaded bars) and divergent (>10% methylation difference, open bars) sites, right top and bottom, respectively. Human genome total CpG sites were derived from the human genome sequence and downloaded through the WashU EpiGenome Browser (https://egg.wustl.edu/d/hg19/CpGsites.gz). Note: chr, chromosome; CpG, 5′-cytosine-phosphate-guanine-3′; TSS, transcriptional start site; TTS, transcriptional termination site; UTR, untranslated region; WGBS-pool, WGBS library pool; CCDS, consensus coding sequence; WGBS-Prev, publically available data on human sperm from Molaro et al. (2011).