. 2019 Aug 8;127(8):087002. doi: 10.1289/EHP4812

Figure 2.

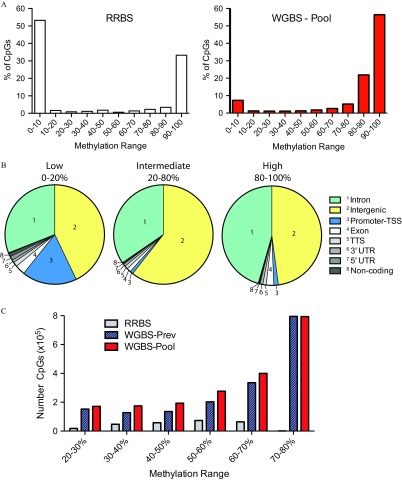
Figure 2A displays two bar graphs titled RRBS and WGBS – pool, plotting percentage of CpGs (ranging from 0 to 60 in intervals of 10) (y-axis) across methylation range (ranging from the series 0–10 to 90–100 with intervals of 10 percent) (x-axis). The graph titled RRBS displays a sudden fall in trend, which is followed by a sudden spike. The graph titled WGBS – Pool displays a sudden spike in the trend. Figure 2B displays three pie charts, namely, low (0 to 20 percent), intermediate (20 to 80 percent), and high (80 to 100 percent), with eight parts each. The labelings for the eight parts are inset as follows: Intron, Intergenic, Promoter-TSS, Exon, TTS, 3 prime UTR, 5 prime UTR, and noncoding. Figure 2C displays a composite bar graph, plotting number of CpGs (times 10 superscript 5) (ranging from 0 to 8 in intervals of 2) (y-axis) across methylation range (ranging from the series 20 to 30 percent to 70 to 80 percent in intervals of 10 percent) (x-axis) for RRBS, WGBS-Prev, and WGBS-Pool.

Distribution of sperm DNA methylation from our WGBS-Pooled sample. (A) Percentage of CpGs with specific DNA methylation ranges sequenced from RRBS (left) the WGBS-Pool (>20×, right). (B) Genomic distribution of CpG sites with low (0–20%), intermediate (20–80%), and high (80–100%) DNA methylation from WGBS-Pool data. (C) Number of CpG sites demonstrating intermediate levels of DNA methylation interrogated by RRBS, WGBS-Prev, and WGBS-Pool. WGBS-Prev data is from Molaro et al. 2011. RRBS data is from Aarabi et al. 2015. Note: CpG, 5′-cytosine-phosphate-guanine-3′; RRBS, reduced representation bisulfite sequencing; TSS, transcriptional start site; TTS, transcriptional termination site; UTR, untranslated region; WGBS, whole genome bisulfite sequencing; WGBS-pool, WGBS library pool; WGBS-Prev, publically available data on human sperm from Molaro et al. (2011).