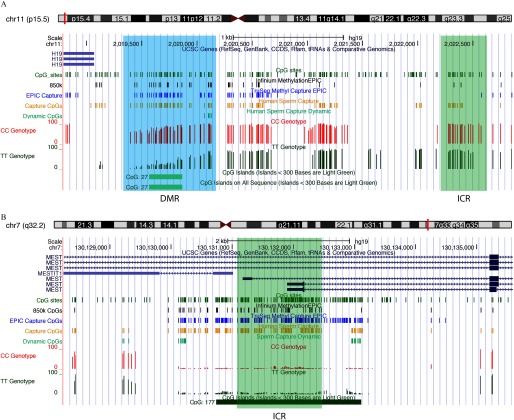
Figure 4.
Examination of imprinted gene methylation from human sperm capture sequencing data. UCSC Genome Browser view of the imprinting control centers (ICRs, green regions) of (A) the paternally methylated gene H19, and (B) the maternally methylated gene MEST. Custom tracks indicate CpG sites (green), CpGs analyzed by Infinium MethylationEPIC array (black), TruSeq® Methyl Capture EPIC (blue), our human sperm Capture (gold), and Dynamic CpG sites (light green). Tracks for representative capture sequencing data (all sequenced sites with coverage are shown) for a CC individual (red) and a TT individual (dark green) are shown. As compared with the gold tracks, which show only on-target CpGs (of a total of 3.13 million; see Figure 3C), more CpG sites are marked in the CC and TT tracks as sites sequenced at coverage are shown (of a total of 11.1 million as shown in Figure 3C). Note: chr, chromosome; CpG, 5′-cytosine-phosphate-guanine-3′; DMR, differentially methylated region; ICR, imprinting control region; UCSC, University of California, Santa Cruz; CDDS, consensus coding sequence.

