. 2019 Aug 8;127(8):087002. doi: 10.1289/EHP4812

Figure 7.

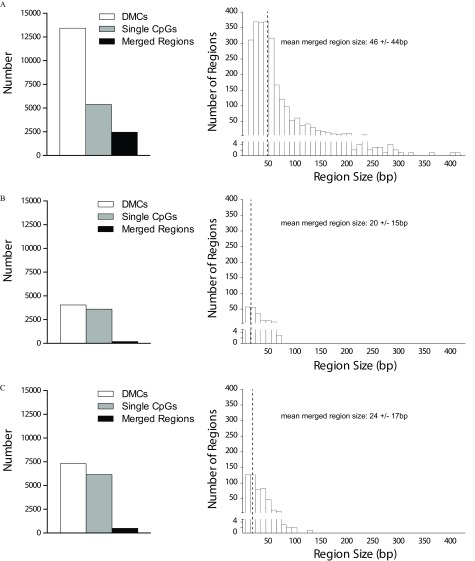
Figures 7A, 7B, and 7C display two bar graphs each, where the first bar graph in each of the three figures plot number (ranging from 0 to 15,000 in intervals of 2,500) (y-axis) across x-axis, representing DMCs, Single CpGs, and merged regions. The second bar graph in Figures 7A, 7B, and 7C plot number of regions (ranging from 0 to 400 in intervals of 50) (y-axis) across region size (ranging from 0 to 400 bp in intervals of 50) (x-axis), representing mean merged region size as 46 plus or minus 44 bp; 20 plus or minus 15bp; and 24 plus or minus 17bp, respectively. There is a break in the graph and its data in each of the three figures, represented by a horizontal space running parallel to the x-axis and starting from point 4 on the y-axis.

Regions of differential methylation following folate metabolism perturbations. (A) Comparisons of MTHFR 677CC vs. 677TT genotypes and effect of folic acid supplementation in (B) 677CC or (C) 677TT participants were examined: left panels—total DMCs, isolated single CpG sites, and merged regions obtained after neighboring DMCs found within 50  bp were merged; right panels—size distribution of merged regions. Note: CpG, 5′-cytosine-phosphate-guanine-3′; DMCs, differentially methylated cytosines; MTHFR, methylenetetrahydrofolate reductase.