. 2019 Aug 8;127(8):087002. doi: 10.1289/EHP4812

Figure 8.

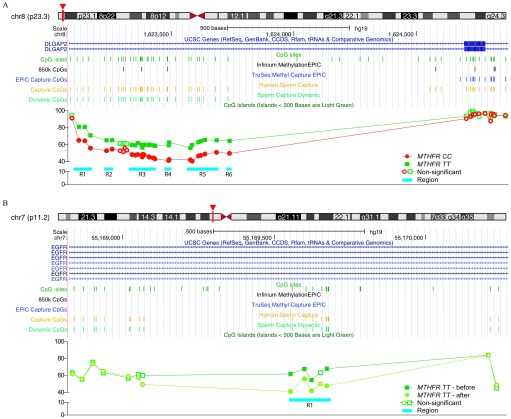
Figure 8A is a Genome browser, displaying differential methylation in men with MTHFR 677CC compared with 677TT genotype. The data is represented on a scale of chr8 (p23.3). They keys inset are as follows: MTHFR CC, MTHFR TT, nonsignificant, and region. Figure 8B is a Genome browser, displaying differential methylation in men with MTHFR 677CC compared with 677TT genotype subjects who have been supplemented with high-dose folic acid. The data is represented on a scale of chr7 (p11.2). The keys inset are as follows: MTHFR TT-before, MTHFR TT-after, nonsignificant, and region.

Observed differential methylation due to MTHFR genotype and following folic acid supplementation. Examples showing regions of differential methylation seen between (A) men with MTHFR 677CC compared with 677TT genotype or (B) following high-dose folic acid supplementation in 677TT subjects. Note: chr, chromosome; MTHFR, methylenetetrahydrofolate reductase; UCSC, University of California, Santa Cruz; CCDS, consensus coding sequence.