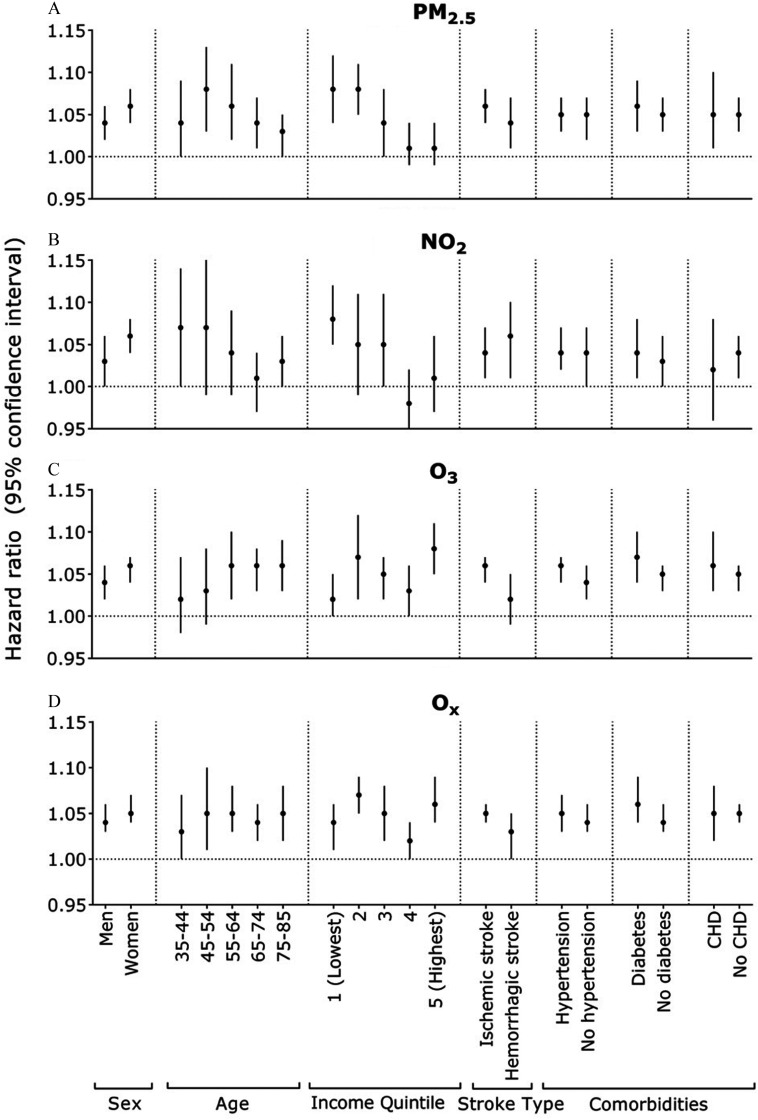
Figure 2.
Hazard ratios for the associations between air pollution (for each interquartile range) and stroke, stratified by certain characteristics. Interquartile range values for pollutants: (), (), () and (). Each subgroup analysis used the fully adjusted model, stratified by an indicator for living in the Greater Toronto Area or not, and adjusted for age, sex, area-level socioeconomic status (education, recent immigrants, unemployment rate, and income quintile), urban/rural area, and northern/southern Ontario, except for the subgroup variable of interest. CHD, coronary heart disease.

