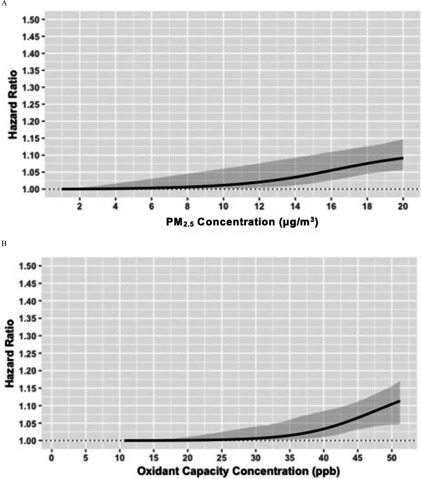
Figure 3.
Shapes of the concentration–response relationship between atrial fibrillation, and . Gray area represents the 95% confidence interval (CI). Fully adjusted model, stratified by an indicator for living in the Greater Toronto Area or not, and adjusted for age, sex, area-level socioeconomic status (education, recent immigrants, unemployment rate, and income quintile), urban/rural area, and northern/southern Ontario.

