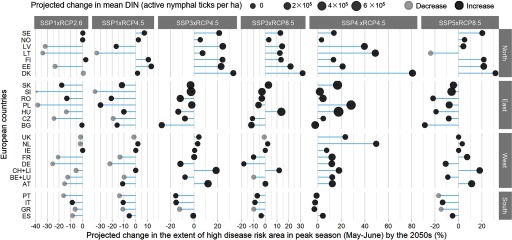
Figure 4.
Projected changes in Lyme disease risk by the 2050s in European countries. The extent of high disease risk area in peak season (%, lines in the figure) and mean density of infected nymphal ticks (per ha, closed circles in the figure, with light/dark gray indicating projected decrease/increase) are summarized across combined scenarios of the Shared Socioeconomic Pathway (SSP) and the Representative Concentration pathway (RCP) changes. The countries are classified into four geographical divisions (north, east, west, and south). Country abbreviations: AT, Austria; BE, Belgium; BG, Bulgaria; CH, Switzerland; CZ, Czech Republic; DE, Germany; DK, Denmark; EE, Estonia; ES, Spain; FI, Finland; FR, France; GR, Greece; HU, Hungary; IE, Ireland; IT, Italy; LI, Liechtenstein; LT, Lithuania; LU, Luxembourg; LV, Latvia; NL, Netherlands; NO, Norway; PL, Poland; PT, Portugal; RO, Romania; SE, Sweden; SI, Slovenia; SK, Slovakia; UK, United Kingdom.

