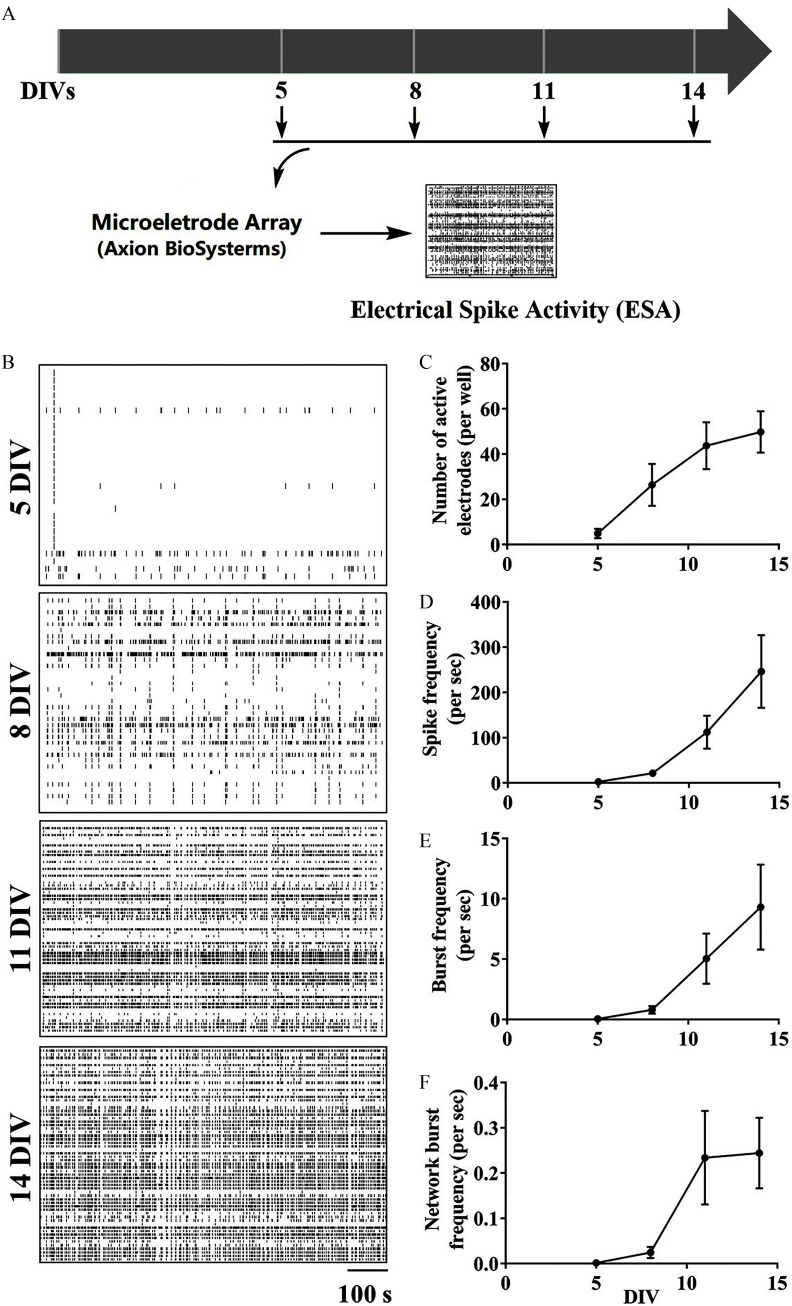
Figure 2.
Developmental patterns of ESA in primary cortical neurons. (A) Graphical paradigm outlining the measurement of ESA development changes in cultured cortical neuronal networks. (B) Representative raster plots of ESA in the same neuronal cultures at 5, 8, 11, and 14 DIVs. (C–F) Quantification of the number of (C) active electrodes, (D) spike frequency, (E) burst frequency, and (F) network burst frequency in neuronal cultures at different DIVs. The mean value of each plate was used as the analysis unit. Each data point shown in (B–E) represents the from three independent cultures. Repeated measurements one-way analysis of variance (ANOVA) analysis was used to analyze the number of active electrodes, spike frequency, burst frequency, and burst frequency during in vitro development. No statistical significance was observed between two different DIVs when using post hoc Bonferroni comparison. Note: DIV, days in vitro; ESA, electrical spike activity.

