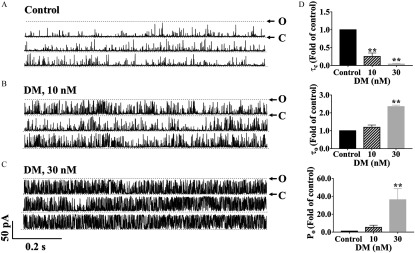
Figure 7.
Influence of nanomolar DM on the gating kinetics of RyR1 channels. (A–C) Representative traces of RyR1 activity in single-channel level in the (A) absence, and (B) presence of and (C) , respectively. (D) Analysis of the gating parameters of mean closed time () (top), mean open time () (middle), and open probability () (bottom). Each data point represents the from three independent channels. Statistical significance between groups was calculated by one-way analysis of variance (ANOVA) followed by post hoc Bonferroni comparison. Note: C, closed state of the channel; DM, deltamethrin; O, open state of the RyR1 channel; , open probability; RyRs, ryanodine receptors; , mean open time; , mean closed time. **, DM vs. control.

