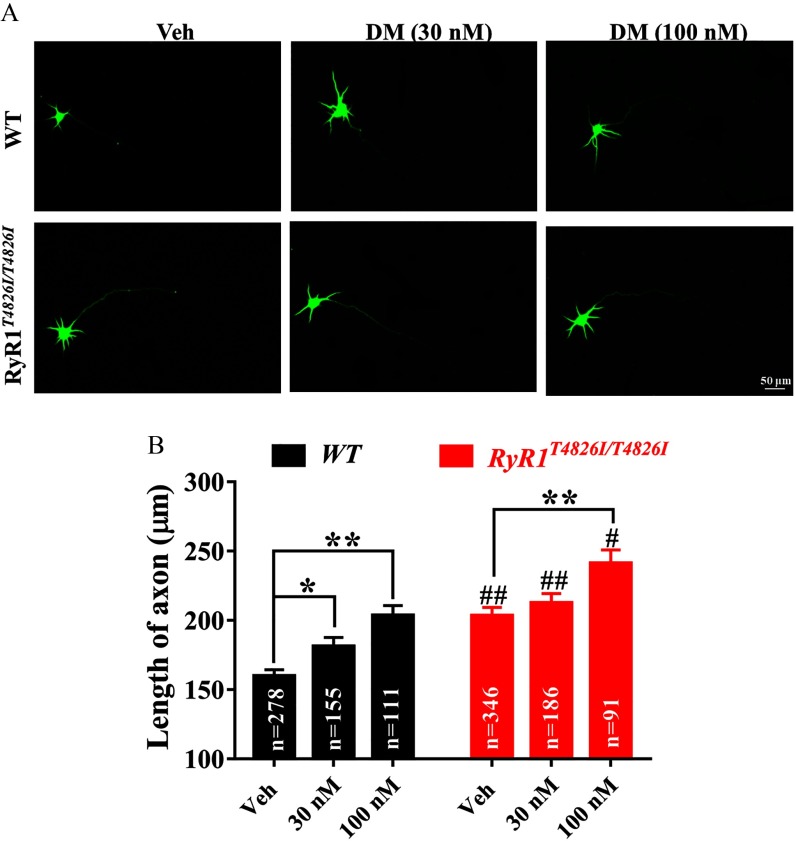
Figure 9.
Impacts of mutation on DM-induced axonal outgrowth. (A) Representative images of WT and mutation neurons exposed to Veh (0.1% DMSO) and DM ( and ) commencing 3 h after plating and immunostained with MAP-2B antibody at 2 DIV. (B) Quantification of the axon length after DM exposure in WT and mutation neurons. The total number of neurons tested was inserted in the bar graph, and axonal length of each neuron was used as analysis unit. Each data point represents the from two independent sister cultures, each with three wells. Statistical significance between WT and neurons was performed using two-way analysis of variance (ANOVA) followed by post hoc Bonferroni comparison. Note: DM, deltamethrin; DMSO, dimethylsulfoxide; RyRs, ryanodine receptors; Veh, vehicle; WT, wild type. *; **, DM vs. Veh; #; ##, vs. WT at same treatment condition. .

