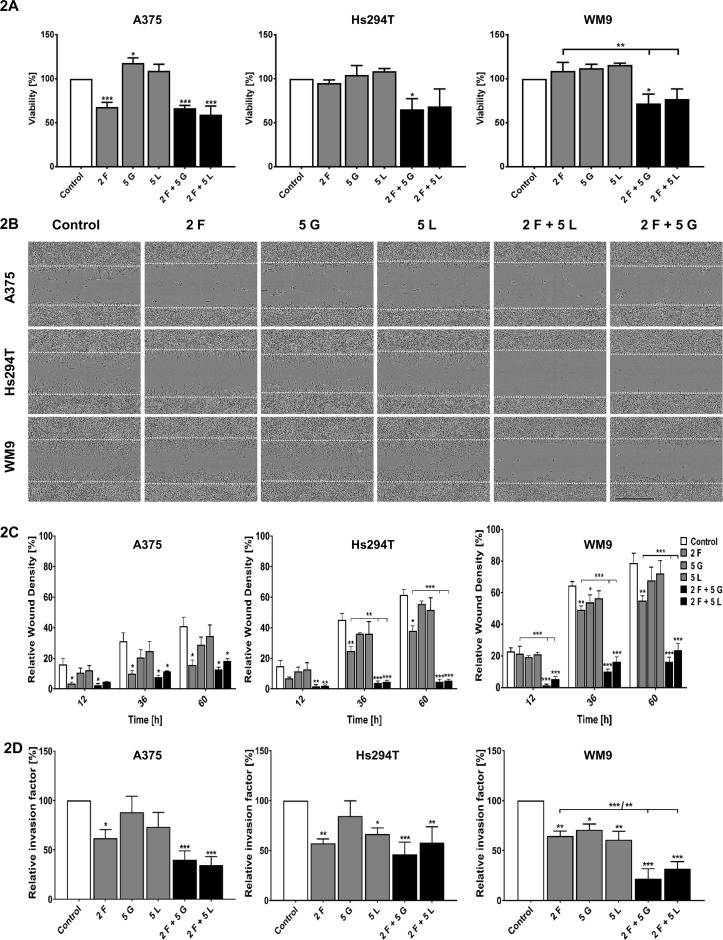
Figure 2.
Viability in 3D conditions and invasion capacities of melanoma cells treated with inhibitors. (A) Viability of melanoma cells present in three-dimensional conditions treated for 24 h with indicated concentrations of foretinib [F], lapatinib [L], and gefitinib [G] independently, or in combinations, was compared to viability of control cells. Results are expressed as the mean (% of control) ± SD of three independent experiments. Asterisks above the bars express significance vs. control unless indicated otherwise. p ≤ 0.05 (*), p ≤ 0.01 (**), p ≤ 0.001 (***). (B,C) Cells were embedded between two layers of Matrigel and then treated with foretinib [F], gefitinib [G], and lapatinib [L] or their combination at the indicated concentrations (µM) for 60 h. (B) Pictures illustrating wound closure. (C) Relative wound density calculated based on pictures with an IncuCyte® Scratch Wound Cell Migration Software Module. (D) The invasion assay conducted on Transwell filters coated with Matrigel for 24 h. Relative invasion capacity was calculated versus control cells, where number of invading cells is set as 100%. Results are expressed as the mean ± SD and are based on at least three independent experiments. Asterisks indicate conditions statistically different from control cells or between particular treatment conditions. The significance level was set at p ≤ 0.05 (*), p ≤ 0.01 (**), and p ≤ 0.001 (***).

