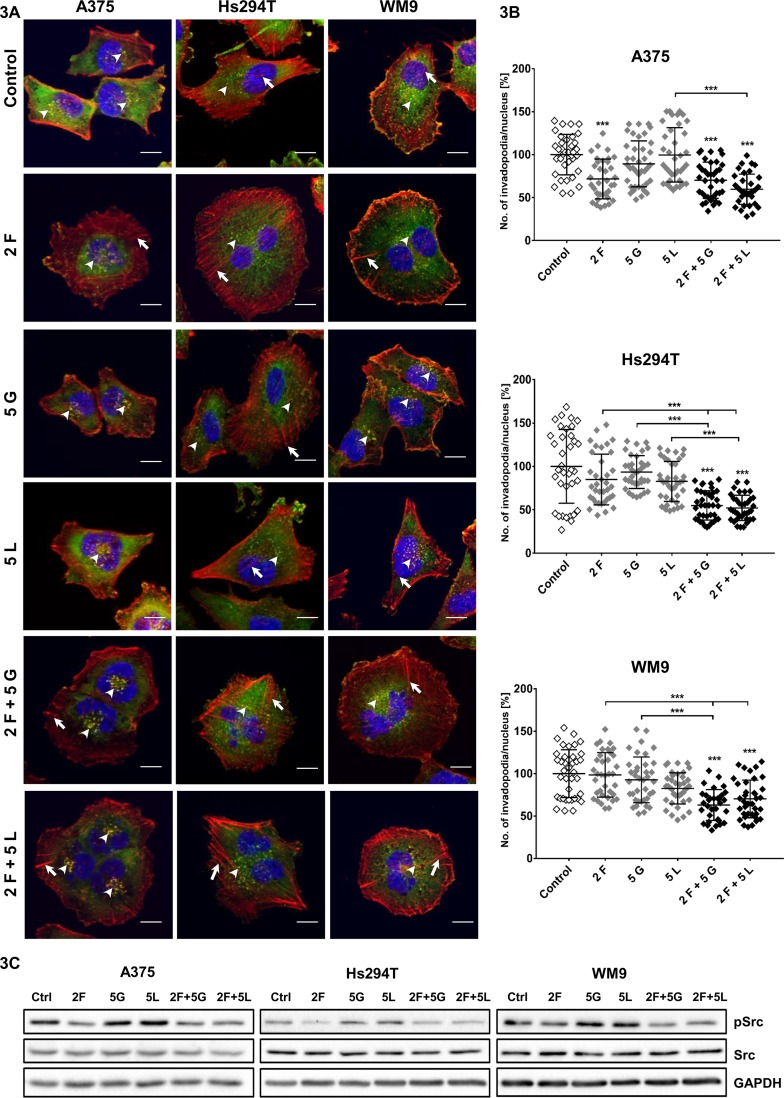
Figure 3.
Influence of inhibitors on invadopodia formation in examined melanoma cell lines. (A) Representative pictures of A375, Hs294T, and WM9 cells (control or treated for 24 h with indicated concentrations (µM) of foretinib [F], lapatinib [L], and gefitinib [G] independently or in combinations) seeded on Matrigel-coated coverslips stained for F-actin (red), cortactin (green), and cell nuclei (blue). Arrowheads indicate invadopodia, while short arrows mark stress fibers. Scale bar—10 µm. (B) Average number of invadopodia per cell nucleus in control and inhibitor-treated cells were calculated using ImageJ software. Invadopodia from 30 cells from three independent experiments were counted. Asterisks indicate conditions statistically different from control cells or differences between inhibitors-treated cells. The significance level was set at p ≤ 0.001 (***). (C) Effect of inhibitors treatment on activity of Src kinase. Cells were incubated with indicated concentrations of drugs independently or in combinations for 4 h. Membranes were probed with specific antibodies against total and phosphorylated forms of Src as well as GAPDH and are representative for at least three independent experiments.

