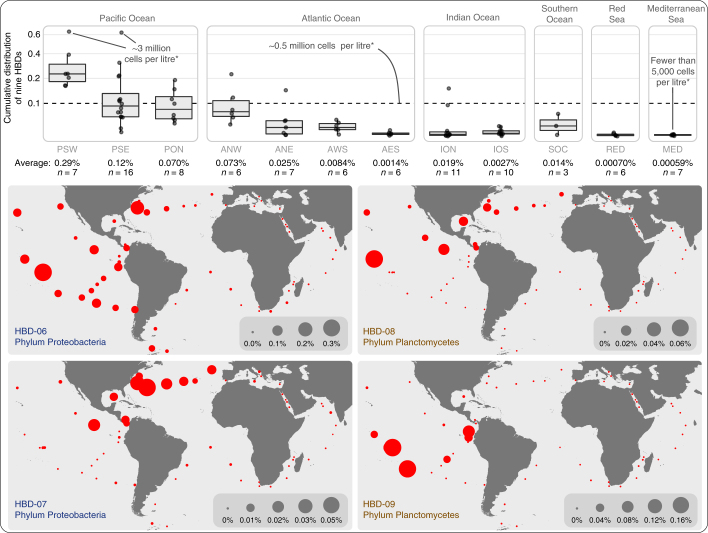
Fig. 3. Abundance of nitrogen-fixing populations of Planctomycetes and Proteobacteria in the surface ocean.
Top: boxplots display the square-root-normalized cumulative relative distribution of the Planctomycetes (n = 2) and Proteobacteria (n = 7) HBDs in 93 metagenomes corresponding to 12 marine geographic regions (*assuming that each litre in the surface ocean contains 0.5 billion archaeal and bacterial cells83). Boxes represent the first quartile, median and third quartile of distribution values, and whiskers of 1.5 × interquartile range. Bottom: maps show the niche partitioning of HBD-06, HBD-07, HBD-08 and HBD-09 at the surface of four oceans and two seas (61 metagenomes from surface samples).

