Figure 2.
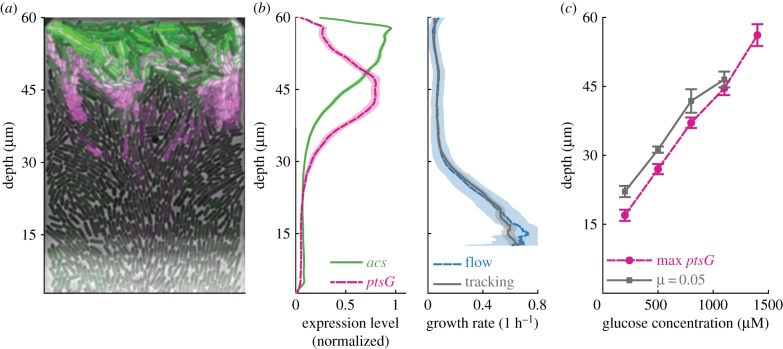
Phenotypic variation arises from nutrient gradients. (a) False-colour image of single chamber. Cells limited by glucose express ptsG (magenta), cells consuming acetate express acs (green). Image brightness and contrast have been adjusted for each colour channel separately. (b) Average gene expression profiles (left) and growth rates (right) of cells when 800 µM of glucose is supplied in the flow channel. Gene expression levels were estimated as the normalized fluorescence intensity of a RFP (ptsG) and GFP (acs) transcriptional reporter located on the same plasmid. Expression levels were averaged over a moving region with a depth of 2 µm and normalized by their maximal values. Profiles show an average of three biological replicates (28 chambers), shaded areas indicate 95% CIs. (c) Depth of gradient measured as the depth at which ptsG reaches maximum expression level (magenta circles) or where growth rates reach a value of 0.05 1 h−1 (grey squares) as function of glucose concentration in the flow channel. Data show the average value of 10 chambers (five for 1400 µM) from one biological replicate, bars indicate 95% CIs. (Online version in colour.)

