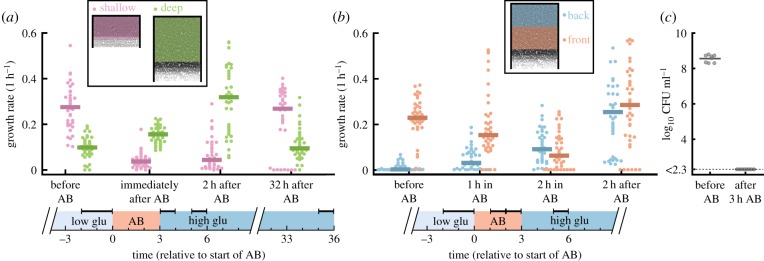
Figure 4.
Spatially structured populations are tolerant to antibiotics. Cells were first grown on low glucose medium for 9 h, exposed to 3 h of 50 µg ml−1 streptomycin (AB), and finally grown in high glucose medium for 35 h. (a) Cells in 60 µm deep chambers (green) cope better with antibiotic treatment than cells in 30 µm shallow chambers (pink). In shallow chambers population growth rates decrease strongly during antibiotic treatments and take a long time to recover (eight chambers have zero growth even after 32 h), while in deep chambers growth rates remain high during the entire treatment. Horizontal bars on top of timeline indicate the analysed time periods. (b) Cells in the back of the chamber (blue) tolerate antibiotics better than cells in the front (red). During antibiotic treatment, the average growth rate in the front of the chamber decreases, while that in the back of the chamber increases. Two hours after treatment, the average growth rate in the front of the chamber is high again as the non-growing population is fully replaced by growing cells coming from the back (see electronic supplementary material, movie S1). Horizontal bars on top of timeline indicate the analysed time periods. (a,b) Each dot shows the average population growth rate inside the coloured region shown in the schematics. Negative growth rates were set to 0. Bars show median values. Growth rates were averaged over the time windows indicated by the horizontal bars at the top of the timelines. (c) Cells in batch cultures cannot survive antibiotic treatment. Colony-forming units (CFU) per ml are shown for eight replicate batch cultures just before and 3 h after addition of 50 µg ml−1 streptomycin. After 3 h of antibiotic exposure, all eight cultures had a CFU count below the detection limit (of 200 CFU ml−1), corresponding to a decrease in CFU counts by at least a factor . (Online version in colour.)

