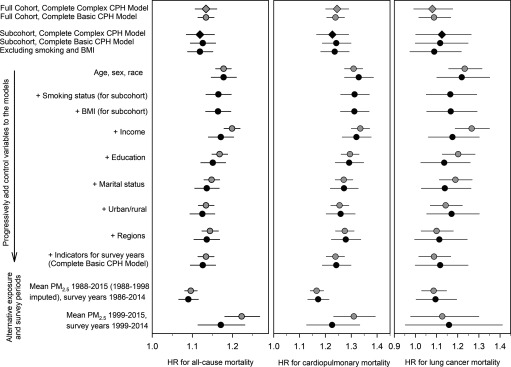
Figure 2.
Illustration of model sensitivity analysis. Hazard ratios (and 95% CIs) associated with estimated from various models are presented. Gray and black symbols indicate models that use the full cohort and subcohort, respectively. Diamonds indicate complex CPH models that control for the complex survey design, whereas circles indicate models that use the basic CPH models. Cause-of-death groupings are based on ICD-10 codes. Cardiopulmonary disease includes cardiovascular disease (I00–I09, I11, I13, I20–I51), cerebrovascular disease (I60–I69), chronic lower respiratory disease (J40–J47), and influenza and pneumonia (J09–J18). Lung cancer includes C33–C34. CI, confidence interval; CPH, Cox proportional hazards (regression model); HR, hazard ratio; , particulate matter in aerodynamic diameter; ICD-10, International Statistical Classification of Diseases, Injuries, and Causes of Death, Tenth Revision.

