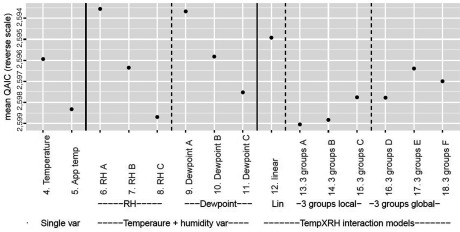
Figure 1.
Preliminary investigation of goodness of fit of alternative models for humidity. The y-axis shows the goodness of fit as measured by qAIC (quasi-Akaike’s information criterion), averaged over all 445 locations, in reverse order so that higher points better fit the model. All models from model number 6 include temperature [4-degrees of freedom (df) natural cubic spline] plus a range of humidity terms. Models 6–8 include RH (relative humidity) as linear (A), quadratic (B) and cubic (C) polynomials, and models 9–11 are the same for dewpoint. Models 12–18 include, in addition to a linear term for RH, a range of forms of interaction between temperature (temp) and linear RH: linear temperature (model 12); separate RH slopes for each of three groups of temperature with cut points defined by location-specific (models 13–15) and global (models 16–18) percentiles. Further detail is provided in Table S4.

