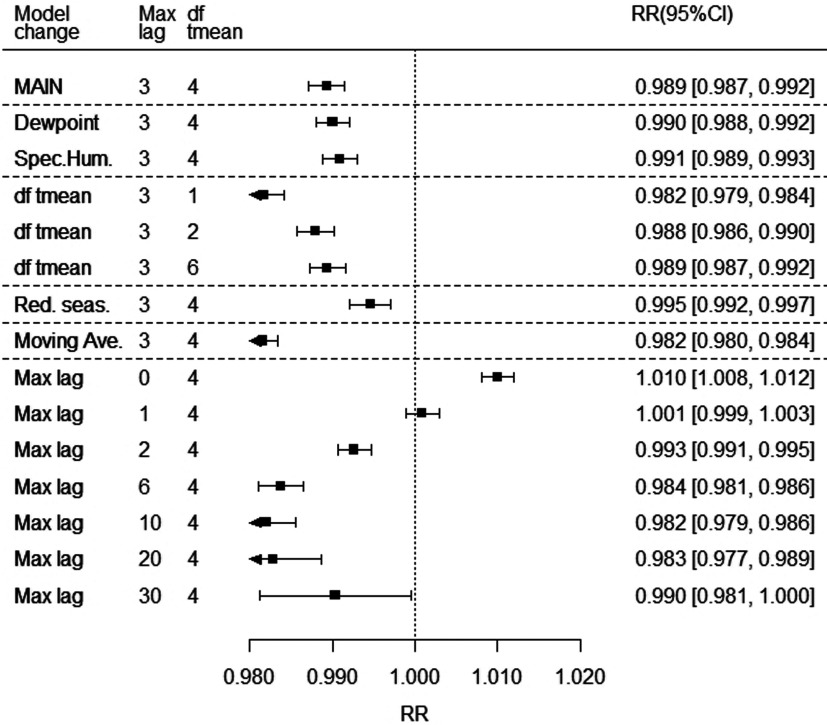
Figure 4.
Sensitivity of relative humidity (RH) coefficient estimate to model specification. The figure shows the meta-analytic mean of the coefficient of RH, expressed as rate ratio (RR) for an incement in relative humidity (RH) of 23.4%, which is the mean of 99th percentile anomalies (residual given temperature) over all 445 locations. The top row shows the value of the main model (as in Figure 2), and other rows modify this model as indicated: a) replacing RH with dewpoint and specific humidity, showing RR for the mean of their 99th percentile anomalies: 5.2°C and ; b) df tmean, modifying the flexibility of the temperature term; c) “Red.seas,” reducing seasonal control by omiting season by year interaction terms; d) “Moving ave.,” replacing the 3-lag-strata distributed lag nonlinear model (DLNM) by a single stratum, equivalent to using a moving average of humidity (and temperature) over lags 0–3; and e) “Max lag,” changing maximum lag of the model, with lags 6–30 with additional lag strata breaking at lags 4,7,14, and 21. Note: CI, confidence interval; df, degrees of freedom.

