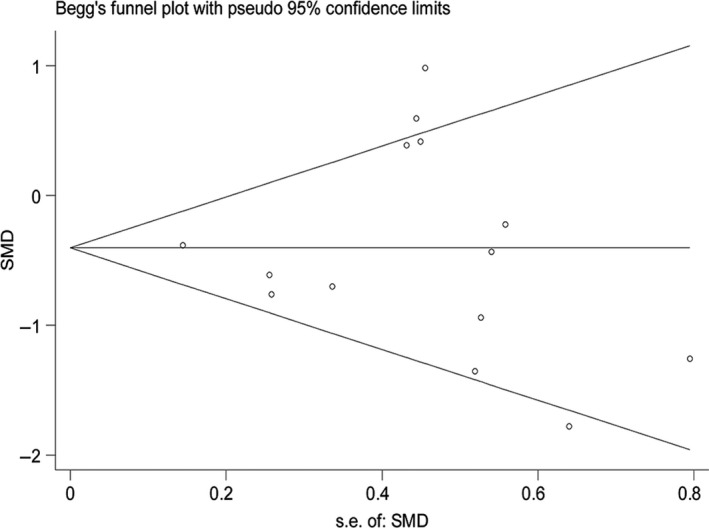
Figure 8.

Funnel plot of HIF‐1α expression level in 14 microarrays related to MDS and the control group. HIF‐1α, hypoxia‐inducible factor 1 alpha; MDS, myelodysplastic syndrome; SMD, the standardized mean difference

Funnel plot of HIF‐1α expression level in 14 microarrays related to MDS and the control group. HIF‐1α, hypoxia‐inducible factor 1 alpha; MDS, myelodysplastic syndrome; SMD, the standardized mean difference