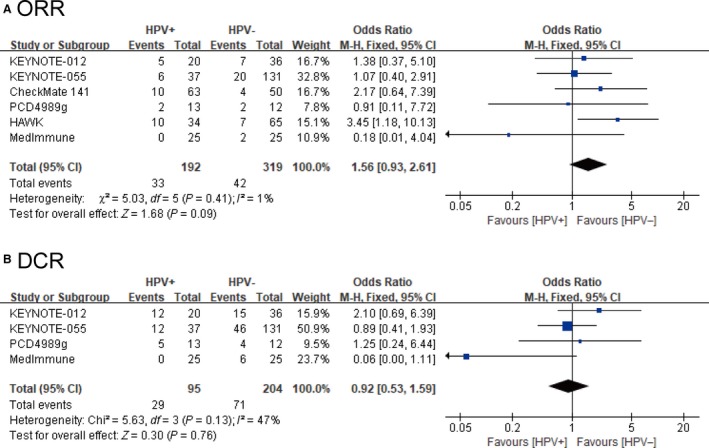
Figure 4.

Forest plots of objective response rates and disease control rates for the meta‐analysis. A, Forest plot of odds ratio for objective response rates between human papillomavirus (HPV) positive and HPV negative head and neck cancer patients. B, Forest plot of odds ratio for disease control rates between HPV positive and HPV negative head and neck cancer patients. CI, confidence interval; I 2, index of heterogeneity; DCR, disease control rate; M‐H, Mantel‐Haenszel statistical method; ORR, objective response rate
