Figure 3.

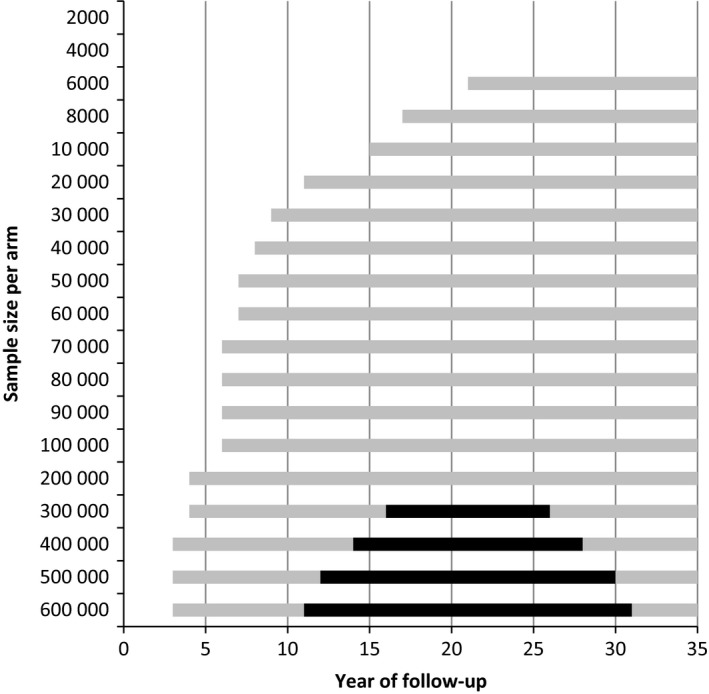
The period of follow‐up in which a significant difference in breast cancer mortality (gray and black bars) or all‐cause mortality (black bars) can be found by number of women in each arm

The period of follow‐up in which a significant difference in breast cancer mortality (gray and black bars) or all‐cause mortality (black bars) can be found by number of women in each arm