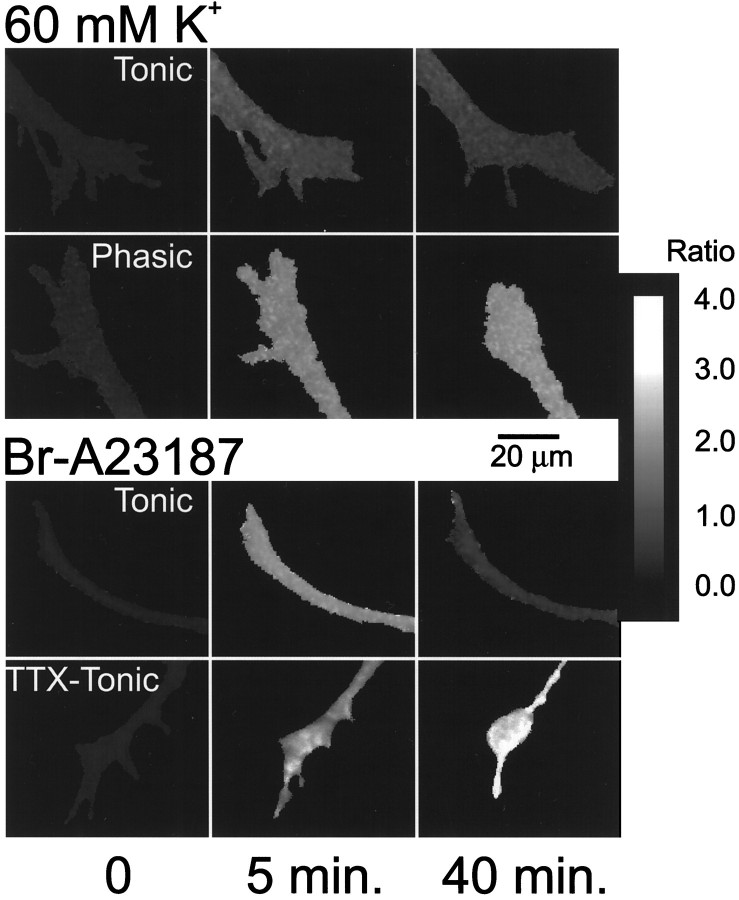
Fig. 1.
Ratio map of fura-2 fluorescence showing changes in [Ca2+]i in neurites and growth cones during application of medium containing 60 mmK+ or Br-A23187. Top, Medium containing 60 mm K+ was applied to growing phasic and tonic axons. After 5 min, [Ca2+]i increased in both phasic and tonic growth cones, although the increase was greater in the phasic growth cone than the tonic one. Between 5 and 40 min, [Ca2+]i continued to rise in the phasic growth cone, whereas [Ca2+]idecreased in the tonic growth cone. During this period of depolarization, the phasic growth cone clearly retracts, and the tonic growth cone continues to advance, although some of the finer processes are withdrawn. Bottom, Br-A23187 (0.25 μm) was added to tonic axons grown with normal impulse activity (Tonic) and to tonic axons grown with no impulse activity (TTX-Tonic). After 5 min of Br-A23187 application, [Ca2+]i increased in both tonic and TTX-tonic growth cones. During 5–40 min, [Ca2+]i continued to rise in the TTX-tonic growth cones; however, [Ca2+]i decreased in the tonic growth cone. The TTX-tonic growth cone retracts and the tonic growth cone advances slightly. Thus, the previous history of impulse activity determines the ability of the growing axon to regulate intracellular Ca2+. The scale on the right shows the relationship between the ratio and the gray level.

