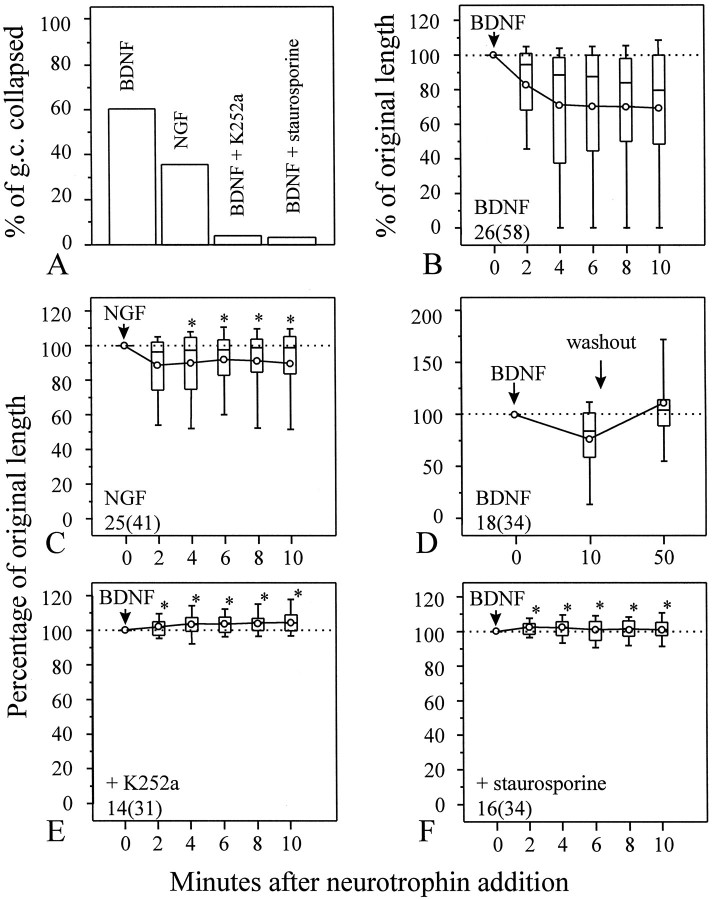
Fig. 2.
Quantitative analysis of growth cone collapse induced by neurotrophins. A, The percentage of growth cones collapsed in response to various neurotrophins is determined by measuring the lengths of each neurite at various times after the addition of neurotrophins. A growth cone is considered to exhibit collapse when it withdraws at least 10 μm, in addition to the morphological changes described in Results. B–F, The growth cone collapse was quantified by measuring the lengths of each neurite at various times after the addition of neurotrophins, normalized against the lengths before the neurotrophin addition, and presented as the percentage of original length (POL). POL did not follow a normal distribution; therefore, the data are presented as the box whisker plots. The boxes enclose the 25th and 75th percentiles; the horizontal lines mark the median; and the error bars denote the 10th and 90th percentiles of the distributions. Circles represent the mean POL.B, Acute application of 50 ng/ml BDNF induced rapid growth cone collapse and neurite retraction, but the related factor NGF had little effect on the neurite length (C). When compared with the POL of BDNF (B) at corresponding times after the neurotrophin addition, NGF caused significantly less collapse than BDNF (*p < 0.05, Mann–Whitney test). D, BDNF-induced growth cone collapse is reversible. When BDNF was washed out at the end of 10 min application, growth cones recovered and resumed extension. E, F, BDNF collapsing effect seems to be mediated by Trk receptor tyrosine kinases. Incubation of cells with 200 nm K252a (E) or 100 nm staurosporine (F) completely blocked BDNF-induced collapse [*p < 0.0001, Mann–Whitney test, compared with the POL of BDNF alone (B) at corresponding times after BDNF addition].Numbers indicate the numbers of cells (growth cones) examined.

