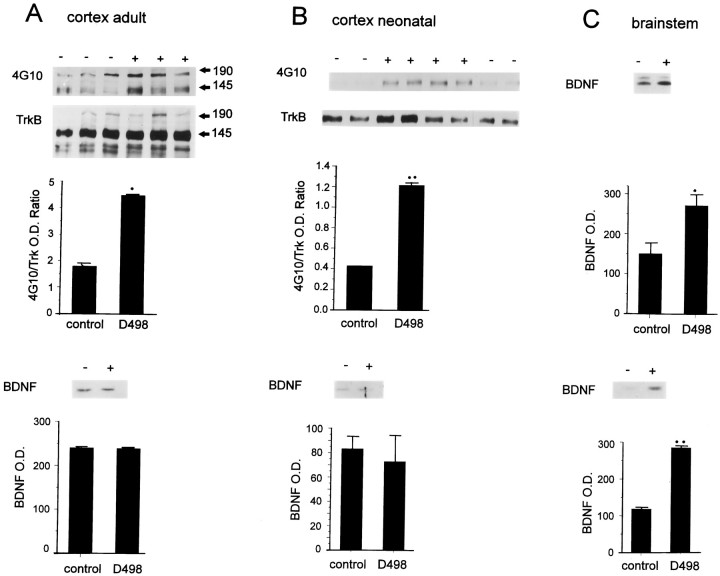
Fig. 4.
A, B, Endogenous levels of TrkB autophosphorylation are increased in the cortex of DBH–BDNF mice, whereas BDNF levels are unchanged. Top, Cortical lysates from individual adult (A) and 1-week-old (B) control (−) and line D498 DBH–BDNF (+) animals were immunoprecipitated with anti-panTrk, and then analyzed by Western blots with antiphosphotyrosine (4G10). To ensure that the observed increases reflected an increase in the activation of TrkB, the blots were reprobed with anti-TrkBout (TrkB). Image analysis quantitation was used to normalize the level of autophosphorylation of the 145 kDa TrkB band relative to levels of TrkB protein. The normalized data (shown in the graphs, with ann of at least 3 individual animals in each case) were analyzed statistically for significance using a Student’st test. *p < 0.05; **p < 0.005. The size of the two TrkB isoforms is indicated by 145 and 190. Bottom, Western blot analysis of BDNF protein in the cortex of individual adult (A) and 1-week-old (B) control (−) and line D498 DBH–BDNF (+) mice. Thegraphs represent image analysis quantification of the data obtained on the same Western blot of three individual control and transgenic animals, with the optical density (O. D.) being arbitrary numbers. C, BDNF levels are increased in the brainstem of DBH–BDNF mice. Western blot analysis of BDNF protein in the brainstem of individual 1-week-old (top) and adult (bottom) control (−) versus line D498 DBH–BDNF (+) mice. The graphsrepresent image analysis quantification of the data obtained on the same Western blot of three individual control and transgenic animals, with the optical density (O. D.) being arbitrary numbers. Statistical analysis of these data demonstrates that BDNF is significantly increased in the brainstem of adult and neonatal DBH–BDNF animals. *p < 0.05; **p < 0.005.

