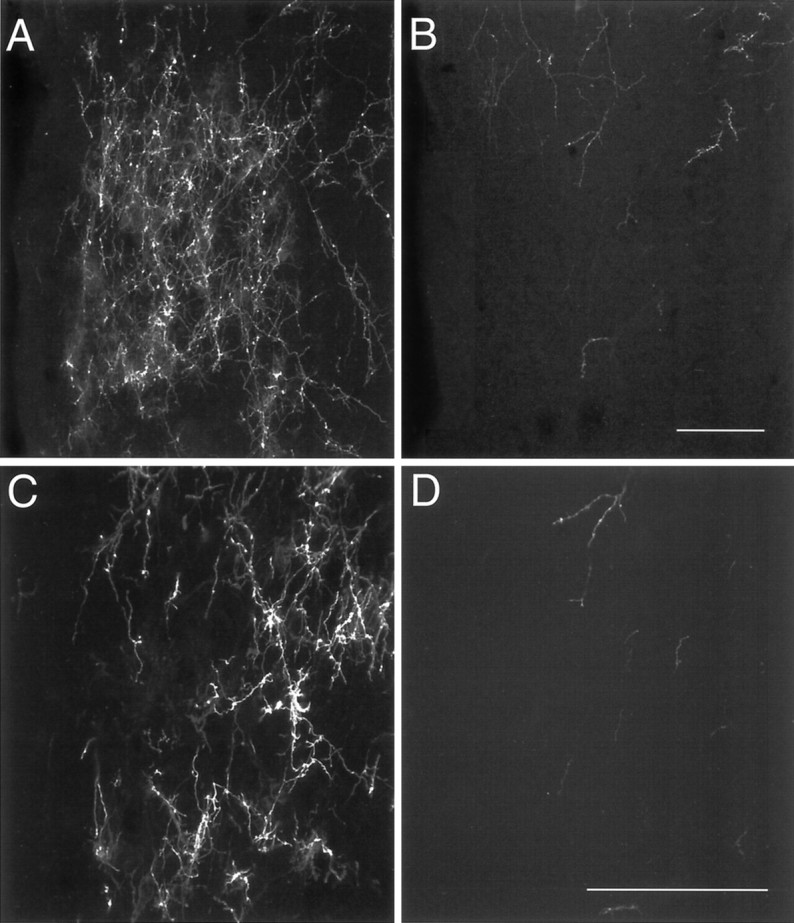
Fig. 7.

Confocal images of DiI-labeled fibers in the AVPV of P10 male (A, C) and female (B, D) rats. A,B, A maximum projection image was derived from 10 confocal images collected (20× objective; NA, 0.75) through a total distance of 20 μm. C, D, Ten confocal images were collected (40× objective; NA, 1.3) through a total distance of 10 μm to produce the projection image shown. Scale bars, 100 μm.
