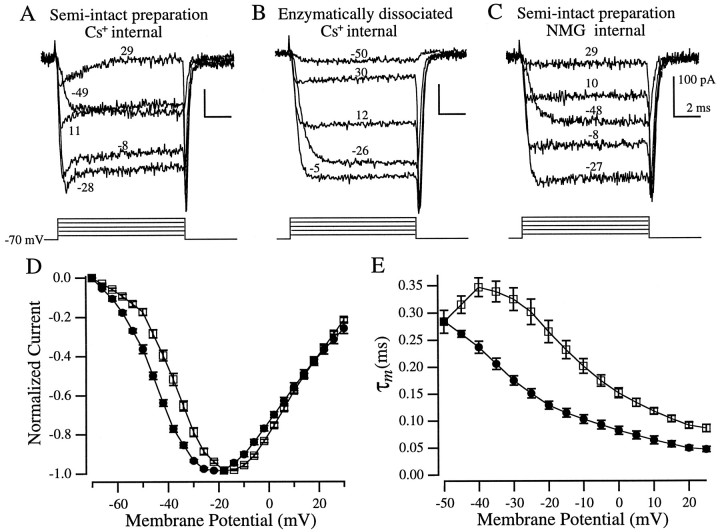
Fig. 10.
Isolation of Ca2+currents. All recordings, except for C, were made with Cs+ internal solution. A, A sag in the inward current was evident in hair cells in the semi-intact preparation but not in enzymatically dissociated hair cells (B). C, NMG internal solution blocked the sag. The corresponding voltage steps (corrected for series resistance errors) are indicated by each trace (A–C). D, Peak Ca2+ current I–Vrelationships from enzymatically dissociated hair cells (□,n = 12) and hair cells in the semi-intact preparation (•, n = 10). E, Ca2+ current activation kinetics (τm, see text for definition) versus membrane potential (symbols are the same as in D: □,n = 11; •, n = 7). All recordings were made in the whole-cell configuration with 10 mm extracellular Cs+ to eliminate the activation of a KIR current during the leak pulses. Values in D and E are mean ± SEM.

