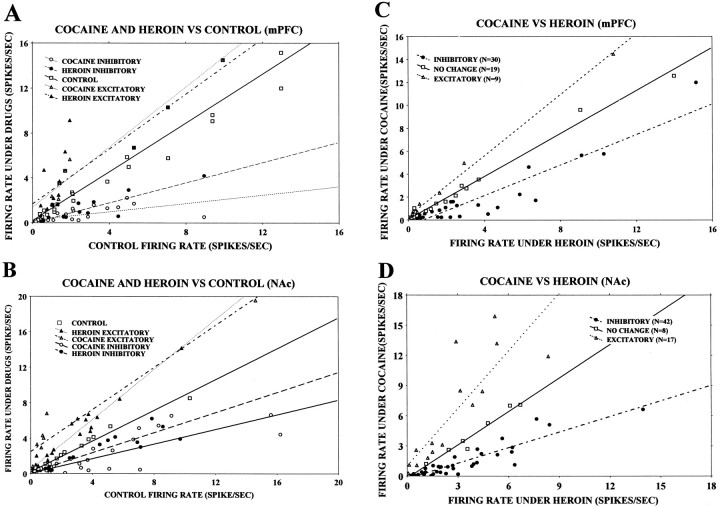
Fig. 11.
Scatter plots of the overall firing rates of mPFC and NAc neurons during cocaine and heroin self-administration and the control period. All the plots are constructed from heroin-first, cocaine-second sessions. A, Comparison of the firing rates recorded from the mPFC during cocaine and heroin self-administration conditions with the control period of that session. The ordinate depicts the firing rate (spikes per second) during cocaine and heroin self-administration trials, and theabscissa depicts the firing rate (spikes per second) for the control condition. Inhibitory responses elicited by cocaine (○) and heroin (•) are under the line that represents the control responses (□), whereas excitatory responses induced by cocaine (▵) and heroin (▴) are above the controlline. B, Same plot as Afor NAc. C, Comparison of the firing rates recorded from the mPFC during cocaine and heroin self-administration periods. Firing rates (spikes per second) during the cocaine self-administration period are represented along the ordinate, and the firing rates during the heroin self-administration trials are represented along theabscissa. Inhibitory responses (•) are defined as a decrease in firing rate under the cocaine self-administration condition in comparison with the heroin self-administration condition. Excitatory responses (▵) are defined as an increase in firing rate under cocaine self-administration in comparison with the heroin self-administration condition. Note that more neurons exhibited inhibitory responses under the cocaine self-administration condition. D, Same plot as in C for the NAc.

