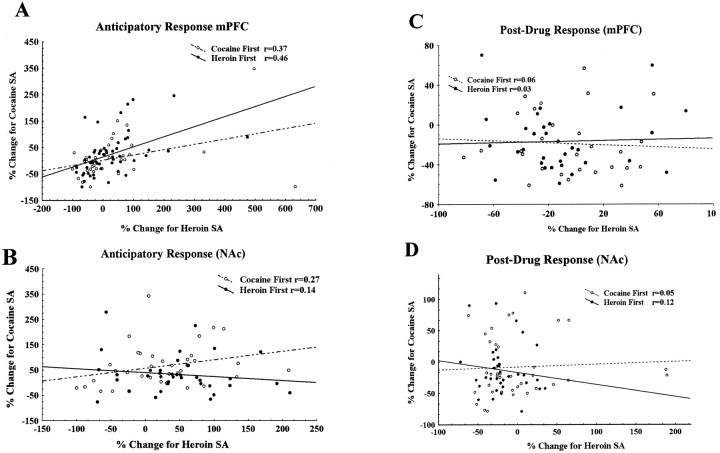
Fig. 6.
Multiple regression analysis of the neuronal responses to cocaine and heroin self-administration from cocaine–heroin and heroin–cocaine sessions. A, Anticipatory responses recorded from the mPFC during the self-administration of cocaine and heroin in the same session. The responses were measured as a percentage change of neuronal activity. Two sessions were plotted in this figure: the cocaine-first, heroin-second session (n = 39, ○) and the heroin-first, cocaine-second session (n = 53, •). The correlation coefficient values (r) for cocaine-first and heroin-first sessions were 0.37 and 0.46, respectively. Both correlations were significant (p < 0.05). B, Same plot as in A for the NAc. The correlations between cocaine and heroin responses are not significant (p > 0.05) for either cocaine-first (r = 0.27;n = 43) or heroin-first sessions (r = 0.14; n = 40).C, Regression analysis for post-drug infusion responses recorded from the mPFC. The regression lines were nearly flat and parallel for cocaine and heroin self-administration in both cocaine-first (r = 0.06; n = 38) and heroin-first (r = 0.03;n = 29) conditions, and there were no significant correlations between cocaine and heroin responses. D, Same plot as in C for NAc. No significant correlations were observed between cocaine (r = 0.05;n = 48) and heroin (r = 0.12;n = 43) post-drug infusion responses.

