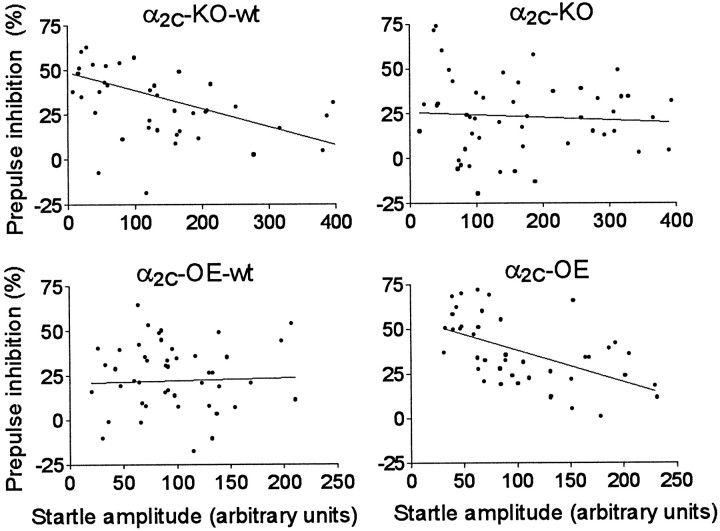
Fig. 6.
Scatter plot of associations between individual mean startle responses to PULSE ALONE stimuli and the percentage of prepulse inhibition (PPI%) of all studied group-housed drug-naive mice from each of the four α2C-AR genotype groups. A statistically significant negative correlation was observed in groups of α2C-KO-wt and α2C-OE mice (p < 0.0014), but not in α2C-KO and α2C-OE-wt mice (p > 0.61) (Pearson product-moment analysis).

