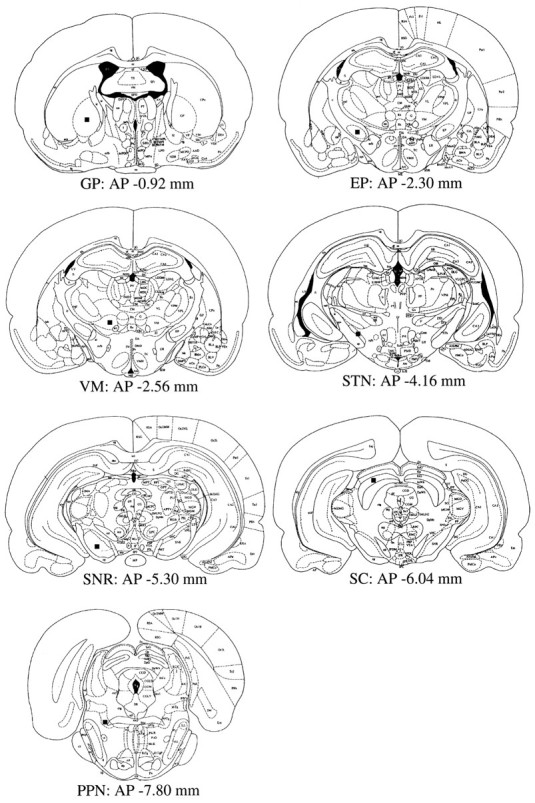
Fig. 1.

Schematic representation of anatomical regions in which c-Fos-positive cell numbers were evaluated (drawn on atlas of Paxinos and Watson, 1982). Closed boxes represent the regions at which a sampling grid for the determination of c-Fos-positive cell density was placed.
