
Fig. 7.
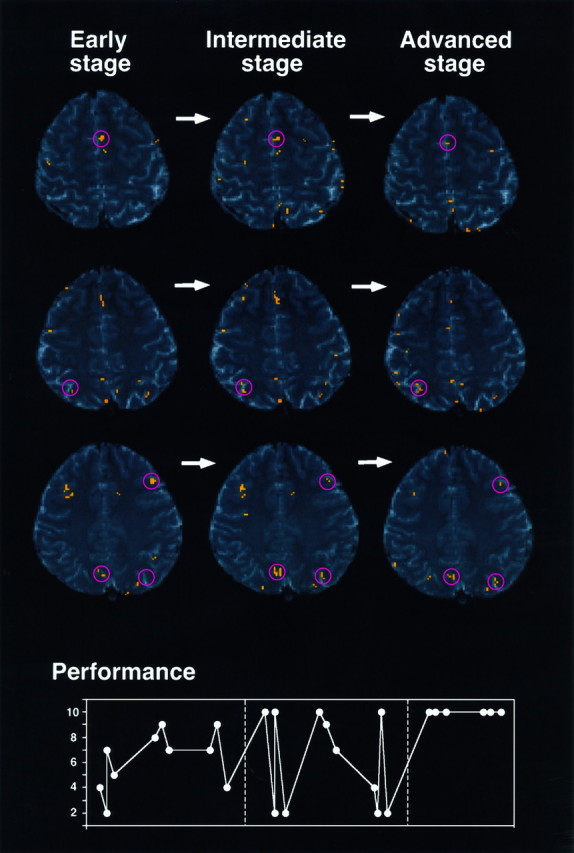
Activation maps for the early, intermediate, and advanced stages (the same subject analyzed in Fig. 3). Three contiguous slices, which correspond to slices 2, 3, and 4 in Figure 3, are shown in the first to third rows, respectively. Clusters of activated pixels are indicated by pink circles. The learning performance of the subject (number of completed sets), on which the determination of the three learning stages (divided by hatched lines) was based, is shown (bottom).